4 Feb 2021
Keith Simpson describes the development of a colour coding system that means gas direction can be monitored on traces.
Keith Simpson
Job Title
Capnography is a fantastic tool for anaesthetists – and the capnograph has now become a standard tool in veterinary practice.
However, features of the capnogram exist that defy absolute interpretation because of a missing element of information.
About three years ago, the author had an idea that has led to the development of a new way of looking at our capnograph traces by incorporating that missing element.
This article sets out to explain how gas direction is the missing element – and how a simple technique has been developed to add that information to the capnogram trace.
Traditional capnography is depicted in two main formats – either as a time capnogram, where CO2 concentration is plotted against time; or as a volume capnogram, where CO2 concentration is plotted against exhaled volume. Both formats are very useful and each imparts slightly different information on the status of the patient.
Volume capnography is used most often in ventilated patients to optimise ventilation parameters, such as positive end-expiratory pressure, or to monitor alveolar recruitment. Despite its many virtues, volume capnography has not found widespread use in general practice, probably because of the relatively expensive equipment and increased complexity in use compared to time capnography.
Therefore, the most commonly used format remains the time capnogram, and this produces the waveforms and data most are familiar with.
A typical waveform is shown in Figure 1.

The capnogram trace has been well studied and the standard phases of the trace are commonly depicted as Phases 0 to III. Figure 2 shows the positions of these phases on the capnogram.
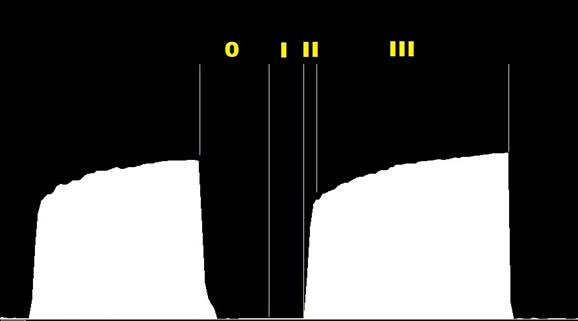
In a normal breath, the phases represent the following:
With a circuit free of dead space and an adequate fresh gas supply, the interpretation of the capnogram is sufficient to ensure successful monitoring. However, changes and problems may arise that can be hidden in the standard time capnogram.
The effect of apparatus dead space on the capnogram is often misunderstood, in the sense that it is commonly believed any increase in apparatus dead space will be seen as a rise in the inspired CO2 and manifest as a non-return to zero of the capnogram trace.
This is definitely not the case and requires a little analysis to understand what is actually happening when dead space is introduced to a circuit.
For any circuit that has the correct flow of fresh gas and the correct operation of any unidirectional valves (such as in a circle system), the addition of dead space will not result in a rise in the inspired CO2 concentration. The additional dead space may well lead to an increase in the end tidal CO2 concentration by virtue of the fact the dead space reduces the effective alveolar minute ventilation.
Let’s use an example to illustrate this analysis.
A patient has a tidal volume of 500ml and is connected to a normally functioning circle system. Under spontaneous breathing, a capnogram such as shown in Figure 3 would be typical.
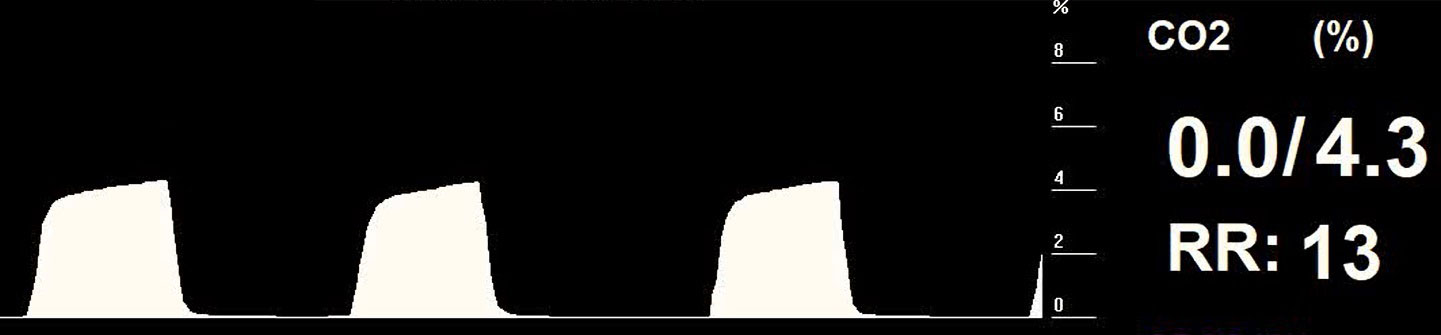
This trace would be considered normal; sharp demarcations of the phases are present, with a clear return to zero of the trace. The end tidal value is 4.3% and the inspired CO2 value is zero.
If 100ml of tubing is added to the patient circuit between the Y-piece and endotracheal tube, this would act as significant additional apparatus dead space. The capnogram obtained from that patient may then look like Figure 4.

Without knowing the details of the patient and the fact significant dead space had been added, this capnogram would also be interpreted as normal. It also has sharp demarcations of the phases, and a clear return to zero of the trace is still present.
What is happening here? How can the addition of 20% dead space result in an apparently normal capnogram?
At the end of expiration, the 100ml of additional dead space is full of CO2-rich gas. During inspiration, this 100ml of CO2-rich gas is drawn back into the lungs past the sampling point of the capnograph. Once this portion of gas has been inhaled, the fresh gas from the inspiratory limb of the circle circuit passes down to the patient. Because this fresh gas has no CO2 content, the capnogram trace now drops to zero.
At the end of expiration, the capnograph measures the high level of CO2 at the end of the plateau, which, in this case, was 4.7%. Therefore the 100ml of dead space was full of 4.7% CO2, which, when inspired, did not change the capnograph reading until the fresh gas reached the patient, at which point the capnogram trace returned to zero.
The effect of the dead space has been to elongate what would traditionally be interpreted as Phase III. In reality, Phase 0 (inspiration) has started significantly before the drop in CO2 content, as will be explained later in the article.
The problem with the traditional capnogram is that the demarcation points of Phase 0 – that is to say, start and stop points – cannot be determined. As described in the example, the start of Phase 0 may not be at the point where the CO2 level starts to drop. With additional dead space, the start of inspiration moves to the left of the knee.
The situation can be further complicated when this condition is encountered in a patient on a circle system. A circle system has no continuous flow of gas; flow only occurs while the patient is either inhaling or exhaling. For that reason, the capnogram trace typically shows a very long “Phase III” period where exhaled gas is sampled by the capnograph long after the end of expiration and before inspiration begins – in other words, during the expiratory pause.
Figure 5 shows a typical capnogram from a patient on a circle circuit with an expiratory pause.

It is clearly not possible to determine where expiration ends and whether any additional dead space is present in the circuit.
We have seen that with additional dead space, the start of Phase 0 moves to the left. What will now be shown is that identifying the end of Phase 0 is important in understanding capnograms from patients where the circuit conditions are incorrect. This can be as a result of inadequate fresh gas flow in a non‑rebreathing circuit, or faulty valves in a circle system.
Figure 6 shows a capnogram with a small secondary rise in CO2 after the main trace. This could be interpreted as a small secondary breath taken by the patient (a sort of double breath) or as a degree of rebreathing; it is not possible to tell which from the capnogram. Normal inspection would suggest the main capnogram trace is normal, but with some variability in duration.

The missing element in the traditional time capnogram is direction.
It is not possible to interpret the capnogram of Figures 4 and 5 fully without knowing the direction of flow of gas relative to the patient. If directional information was known and could be added to the capnogram then it would be possible to visualise the effect of dead space or inadequate fresh gas flow.
When direction information is added, the result is referred to as directional capnography.
Directional capnography is easy to implement since it is only the direction – not the magnitude – of flow that is required.
Once flow direction is included, three states need to be considered: inspiration, expiration and pause. To indicate the three states of flow on a capnograph machine, the simplest solution is to use colours for each state. When this regime is adopted, the result is referred to as colour‑coded capnography. Alternative strategies could be employed on monochrome displays – such as cross‑hatching, solid fill or greyscale. However, since most modern capnographs have a colour screen, colour‑coded capnography is a simple and better implementation.
The following colour scheme is used:
When colour-coded capnography information is added to a normal capnogram, many of the limitations of interpretation are removed.
For a normal capnogram with no rebreathing, no expiratory or inspiratory pause and adequate fresh gas flow, the colour-coded capnogram is shown in Figure 7. This is the colour‑coded capnogram for the patient in Figure 3. Expiration is clearly shown in white and resembles a normal capnogram. Inspiration is clearly shown in blue, and begins at the end of the plateau phase and extends to a point on the base line. Phase I starts at the point where the line turns from blue to white.

Figure 8 shows the colour‑coded capnogram of the patient originally shown in Figure 4. This was a patient with a tidal volume of 500ml and apparatus dead space of 100ml. It can be seen that Phase 0 starts well to the left of the knee and that a large part of inspiration is associated with inhaling CO2-rich gas. This patient has significant and potentially life-threatening rebreathing, which is now clearly indicated.
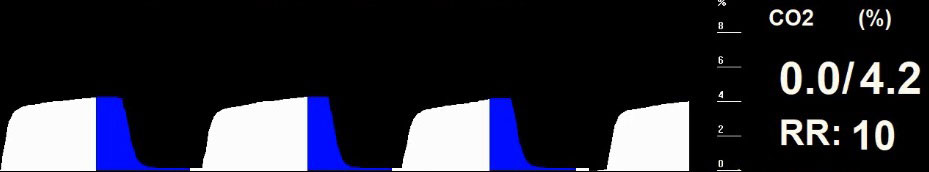
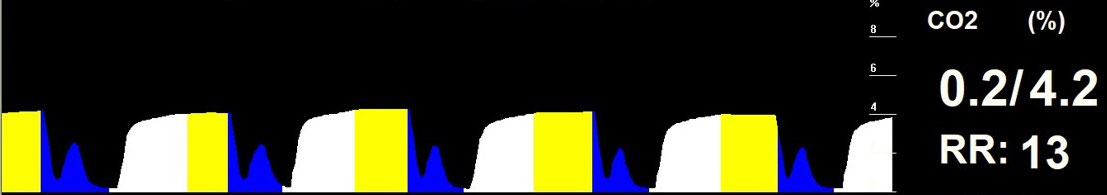
Figure 9 shows the colour‑coded capnogram for the patient in Figure 5. It shows – additionally to a long pause at the end of expiration – a significant amount of rebreathing is occurring. Note again the zero value of the inspired CO2.
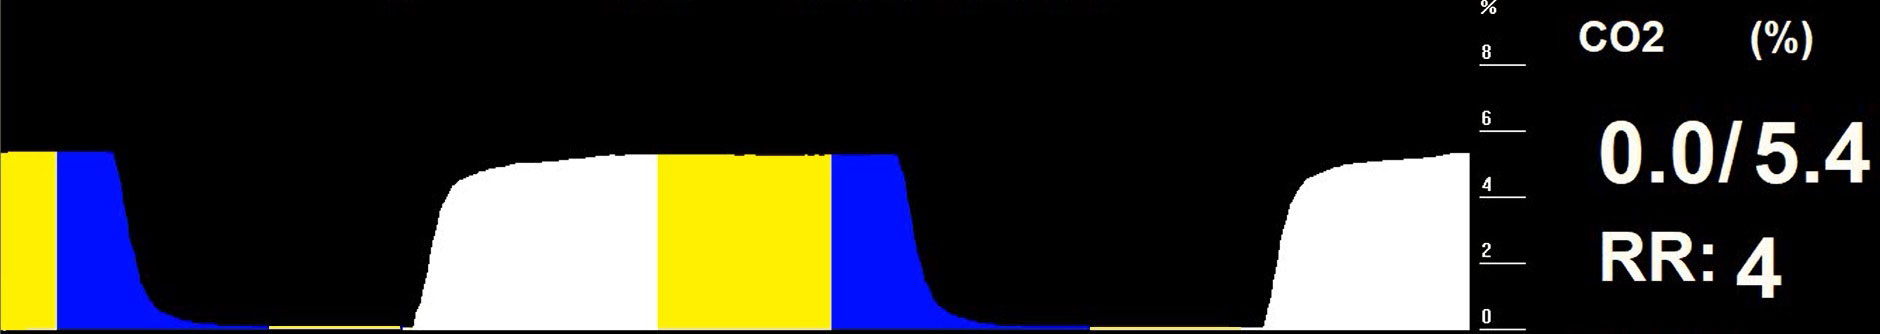
Figure 10 shows the colour‑coded capnogram for the patient in Figure 6. It is now apparent that the secondary waveform is not an additional breath, but forms part of inspiration. Had this been a secondary exhalation then the secondary waveform would have been shown partly in white (exhalation). Since the whole of the secondary waveform is blue, this must represent inspiration and, therefore, rebreathing of previously exhaled gases. No significant dead space is indicated. The rebreathing may be due to inadequate fresh gas flow in the patient circuit or possible valve malfunction in a circle circuit.
Note also the variability of the length of the expiratory pause, shown in yellow. Variability of the main capnogram length could be seen in the original capnogram, but without the assistance of colour-coded capnography it was not possible to tell why this was occurring.
Directional capnography – and its implementation as colour-coded capnography in gas monitoring equipment – provides a means of improving the information in a standard capnogram.
The traditional time capnogram lacks information on direction and, as a result, is unable to clearly indicate conditions of rebreathing and inadequate gas flow in a circuit.
The ability to visualise the effect of dead space, as well as the effects of inadequate circuit function, will lead to rapid correction of suboptimal breathing in patients – reducing risk and improving patient outcome.