28 Jul 2020
Diego Rodrigo Mocholi discusses neurological, cardiovascular and respiratory system tools that can improve the quality of this process.
Diego Rodrigo Mocholi
Job Title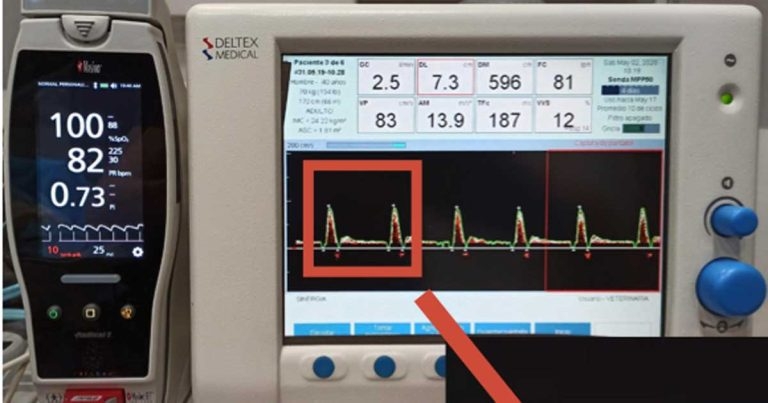
Monitoring during the anaesthetic period is mandatory to reduce the likelihood of adverse events and, therefore, perioperative morbidity and mortality in veterinary medicine.
Although clinicians leading an anaesthesia case should bear in mind that monitoring is essential, the understanding of information from the recorded parameters is vital.
Nowadays, most veterinarians are used to basic cardiorespiratory monitoring during their daily anaesthesia practice. However, older and more recent advances of monitoring are within reach.
The purpose of this article is to briefly describe a few of the atypical monitoring tools that would improve the quality of anaesthesia and analgesia once clinicians are able to include them in the routine daily monitoring.
The sum of excitatory and inhibitory potentials at the postsynaptic areas in the lower layers of the cerebral cortex – more specifically, in the pyramid cells – is monitored by electroencephalography (EEG).
The amount of neurons changing their postsynaptic potentials in the same direction at the same time is represented by the voltage (amplitude) in the EEG. Meanwhile, the reticular activating system – a complex of both neurons that perform their activity in the cortex and the ascending reticular formation neurons – is responsible not only for the consciousness and arousal, but also the reason of the different frequencies of the EEG voltage.
An inverse relationship exists between amplitude and frequency in the waveform, which will represent the level of arousal of the patient. Low amplitude with high frequency waveforms is more typical from alert animals, whereas high amplitude and low frequency is representative of either sleeping or anaesthetised patients.
Five classified EEG frequency ranges exist:
Two techniques exist to process EEG: power analysis and bispectral analysis (BIS).
Power analysis uses the Fourier transform to convert the raw EEG signals during a specific period of time (epoch) into a sum of sine waves each of specific amplitude (half the peak-to-peak voltage), frequency (number of cycles per second) and phase angle (the time offset of the sine wave relative to the start of the epoch).
Although the sine wave amplitude and phase angle – as a function of the frequency – are represented in a histogram to conform the frequency spectrum, the final power analysis results only show the amplitude and frequency of the waves. The phase is ignored as Fourier analysis assumes the EEG signal pattern is constant during the epoch.
The incorporation of the phase relationships from Fourier transform into the analysis is included in the BIS. The inclusion of the phase information, and its analysis by a more complex algorithm, aim for evidence of phase correlation (coupling) among different frequency bands.
EEG in veterinary anaesthesia
Brás et al (2014) studied a number of different indices from EEG assessment in dogs. They showed the temporal entropy and average instantaneous frequency are the indices with most accurate representation for the different phases of anaesthetic depth in dogs.
An increased activity in the low frequency waves – and a decrease in the high frequency – have been revealed by quantitative EEG analysis after IM administration of medetomidine (40µg kg-1) in healthy young (46 months) and adult (90 months) cats (Wrzosek et al, 2009).
However, high variability in the EEG recording has been observed in horses during general anaesthesia (halothane and isoflurane; Williams et al, 2016a; 2016b).
BIS in veterinary anaesthesia
Although the low sensitivity, specificity and predictive values found in dogs makes BIS reliability as a method of assessing anaesthetic depth difficult, BIS monitoring was able to discriminate between light and the surgical plane of anaesthesia in dogs (Bleijenberg et al, 2011).
The change in BIS values after a noxious somatic or visceral stimulus was a reliable measure of anaesthetic depth and useful indicator of early arousal from the hypnotic state in isoflurane‑anaesthetised cats (March and Muir, 2005). Also, BIS could be used to detect CNS depression in sevoflurane‑anaesthetised cats (Lamont et al, 2004).
Although BIS has been shown to be a reliable indicator for awakening, CNS depression degrees are not detected during general anaesthesia (halothane, isoflurane, sevoflurane or propofol) in horses (Haga and Dolvik, 2002; Yamashita et al, 2009; Beldao et al, 2010; Tokushige et al, 2016).
Pain in veterinary medicine is defined as “an aversive sensory and emotional experience representing an awareness by the animal of damage or threat to the integrity of its tissues; it changes the animal’s physiology and behaviour to reduce or avoid damage, to reduce the likelihood of recurrence and to promote recovery” (Molony and Kent, 1997).
However, nociception consists of the processes of transduction, transmission and modulation of neural signals generated in response to an external noxious stimulus.
Nowadays, monitoring responses after noxious stimuli during maintenance of anaesthesia remains a challenge in veterinary medicine.
Parasympathetic tone activity (PTA) is a non‑invasive and continuous monitoring tool for intraoperative nociception in veterinary medicine. PTA contains software from three different species (canine, feline and equine) and provides a numerical index scale (0 = high stress; 100 = low stress).
PTA records a surface ECG (lead II) using a three‑lead system attached to the skin and uses the heart rate variability (HRV). The changes in the parasympathetic and sympathetic outflow from the CNS to the sinoatrial node mediate the HRV. Meanwhile, low frequency changes in HRV are related to both parasympathetic and sympathetic function; high fluctuations in HRV are mediated by parasympathetic outflow.
The advantage is HRV anticipates cardiovascular changes (alteration in heart rate and/or arterial blood pressure), thereby making PTA a reliable monitor to anticipate haemodynamic responses related to noxious stimuli.
PTA in veterinary anaesthesia
PTA monitoring has been shown to identify nociceptive stimuli at intensities lower than those eliciting obvious clinical cardiovascular changes and is associated with good performance for nociception assessment in anaesthetised dogs (Mansour et al, 2017; Aguado et al, 2020).
Static indicators of preload, such as central venous pressure or pulmonary artery occlusion pressure, have lately been less useful for predicting fluid responsiveness due to their limitations and the lack of reliable data to support their use as a fluid therapy guide.
Recently, the use of dynamic markers of volume responsiveness have provided more useful information; the variations in arterial blood pressure during positive pressure mechanical ventilation being the most widely studied.
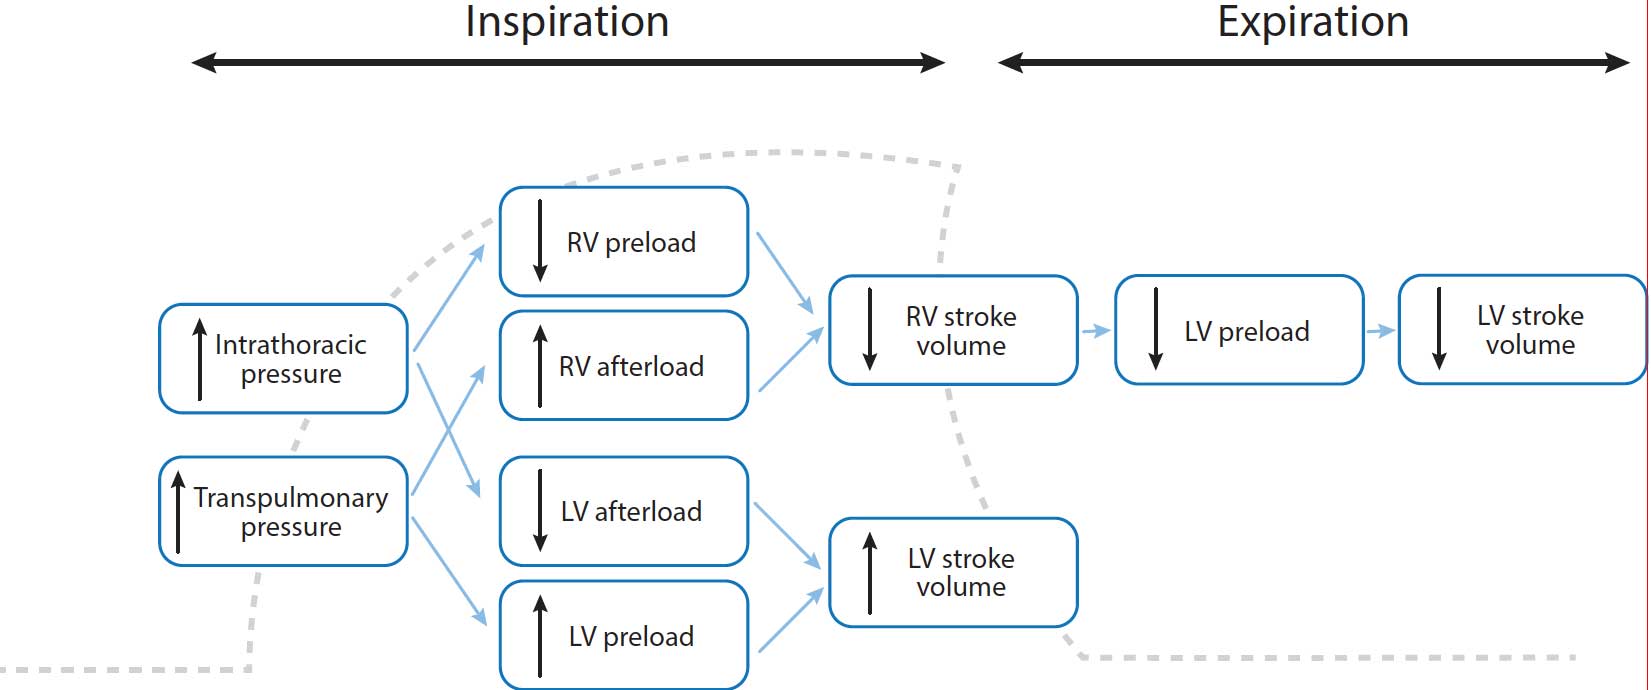
The use of positive pressure mechanical ventilation increases lung volume during early inspiratory phase, thereby increasing left ventricular (LV) preload as the pulmonary blood venous reservoir is displaced into the left heart chambers. However, the increase in intrathoracic pressure reduces LV afterload.
Both the increase in LV preload and decrease in afterload are responsible for an increase in LV stroke volume, which causes an increase in systemic arterial blood pressure.
At the same time during early inspiration, a decrease in systemic venous return and right ventricular (RV) preload is shown due to the increase of intrathoracic pressure.
Additionally, increasing lung volume may also increase pulmonary vascular resistance and, thereby, increase RV afterload. Both effects are combined to reduce RV stroke volume.
During early expiration, this reduced RV stroke volume crosses the pulmonary vascular bed and leads to reduced LV preload. Then, LV stroke volume falls and systemic arterial blood pressure decreases (Figure 1).
Fluid responsiveness is defined as the ability of the heart to increase its stroke volume in response to a fluid bolus. According to the Frank‑Starling principle, increasing preload increases the LV stroke volume if the ventricle is functioning on the steep portion of the Frank‑Starling curve. However, if the LV is functioning on the flat portion of the curve, further fluid loading has little effect on the stroke volume (Figure 2).
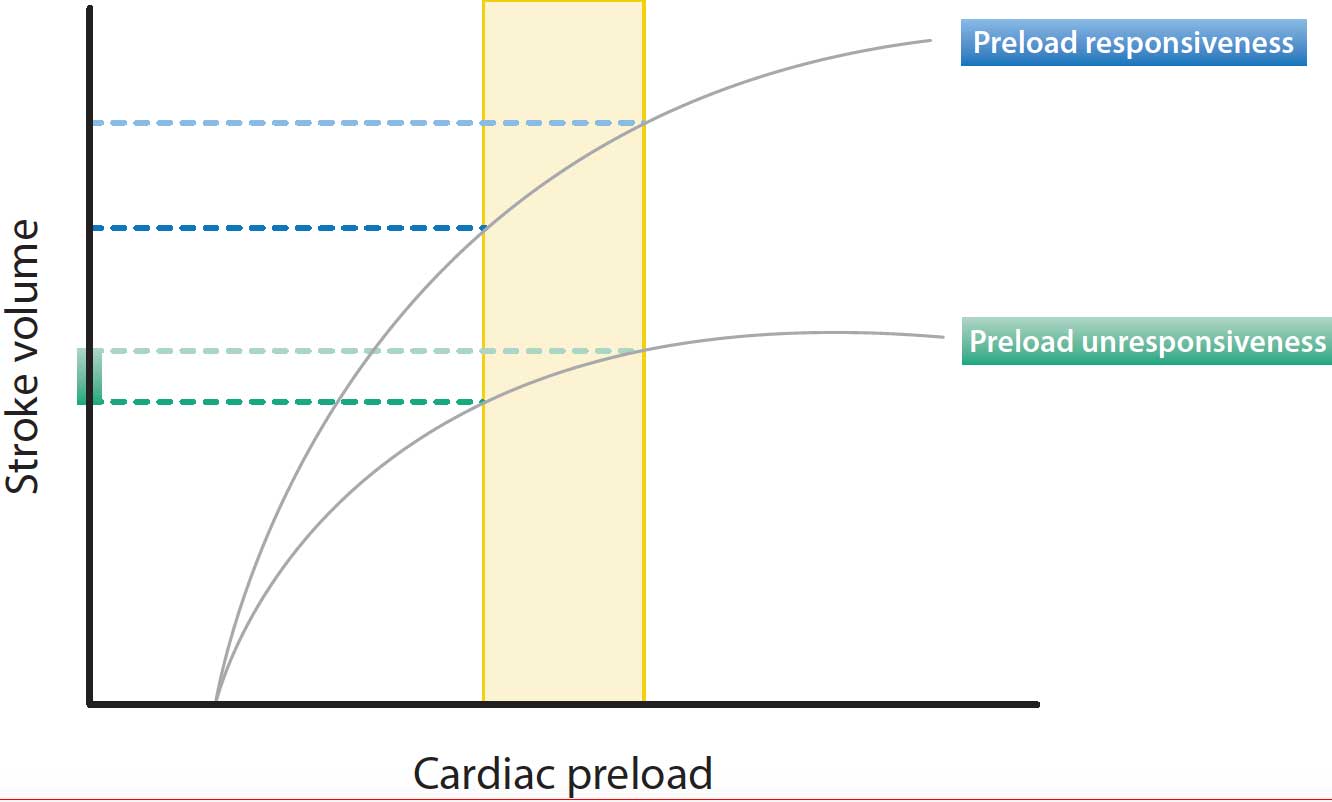
Both ventricles of a healthy heart generally operate on the steep portion of the Frank‑Starling curve and the patient is fluid responsive.
Systolic pressure variation (SPV) is defined as the difference between maximum and minimum systolic pressure during a respiratory cycle.
SPV is further divided into inspiratory and expiratory components by measuring the increase and decrease in systolic pressure in relation to the end-expiratory apnoeic baseline pressure. SPV (%) is calculated as follows:
SPmax is the maximum systolic pressure during inspiratory phase and SPmin is the minimum systolic pressure during the expiration period.
SPV in veterinary anaesthesia
An SPV greater than 4.5% predicts a cardiovascular response (10% increase in blood pressure and/or 10% decrease in heart rate) after a fluid challenge (3ml/kg-1) in anaesthetised and mechanically ventilated dogs with healthy cardiovascular systems (Rabozzi and Franci, 2014). However, conflicting results have been shown in equine anaesthesia (Langdon Fielding and Stolba, 2012).
Pulse pressure variation (PPV) is the ratio of the maximal difference in arterial pressure measured over the course of the positive pressure respiratory cycle, divided by the average of the maximal and minimal pulse pressure.
The formula to calculate PPV (%) is: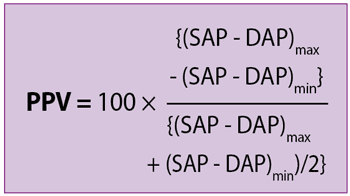
SAP is systolic arterial blood pressure and DAP is diastolic arterial blood pressure.
PPV in veterinary anaesthesia
PPV values greater than 7% to 16% have been shown to predict fluid responsiveness in anaesthetised dogs (Araos et al, 2020).
Cardiac output (CO) is defined as the volume of blood per minute pumped from the left ventricle, and is the result of multiplying the heart rate (HR) by the stroke volume (SV). SV is considered the volume of blood passing through the aortic valve over a given cardiac cycle.
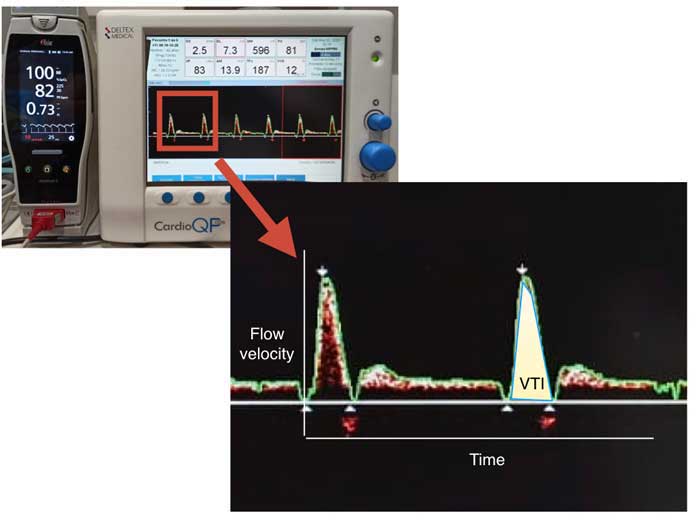
Transoesophageal Doppler (TOD) is a non‑invasive and continuous monitoring of CO, which uses a Doppler ultrasound probe inserted into the oesophagus to measure the flow of blood in the descending aorta.
Once an optimal flow profile is obtained and the shift in frequency of red blood cells is determined, the blood flow velocity (V) is calculated by the ultrasound processor using the following equation: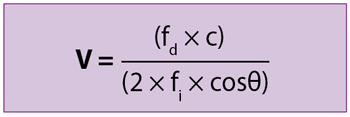
fd is the Doppler shift in frequency, c is the velocity of the ultrasound wave in the tissue, fi is the initial ultrasound frequency and θ is the angle of the ultrasound beam in relation to the blood flow.
The tracing of the boundary of the V profile allows the determination of its integral over time. The velocity-time integral (VTI) is calculated from the area under the curve and represents the distance blood travels during one beat (also called stroke distance; Figure 3).
Also, a measurement of the cross-sectional area (CSA) of the aorta is taken as an estimation of the SV. Therefore, CO is calculated as follows:
A correction factor is usually applied because approximately 70% of the CO passes through the aorta.
Limited data can be found in the veterinary literature about TOD.
Canfrán et al (2015) showed low to minor levels of agreement between TOD and measurement method of CO by thermodilution; therefore, TOD could not be considered a reliable method of absolute CO in healthy anaesthetised beagles.
However, TOD showed promising results on detection of haemodynamic changes after ligation of the ovarian pedicles during different intraoperative analgesic protocols in bitches undergoing ovariohysterectomy (Sández et al, 2018).
By definition, dead space is the portion of the ventilation that is not participating in gas exchange because no contact with the pulmonary circulation exists.
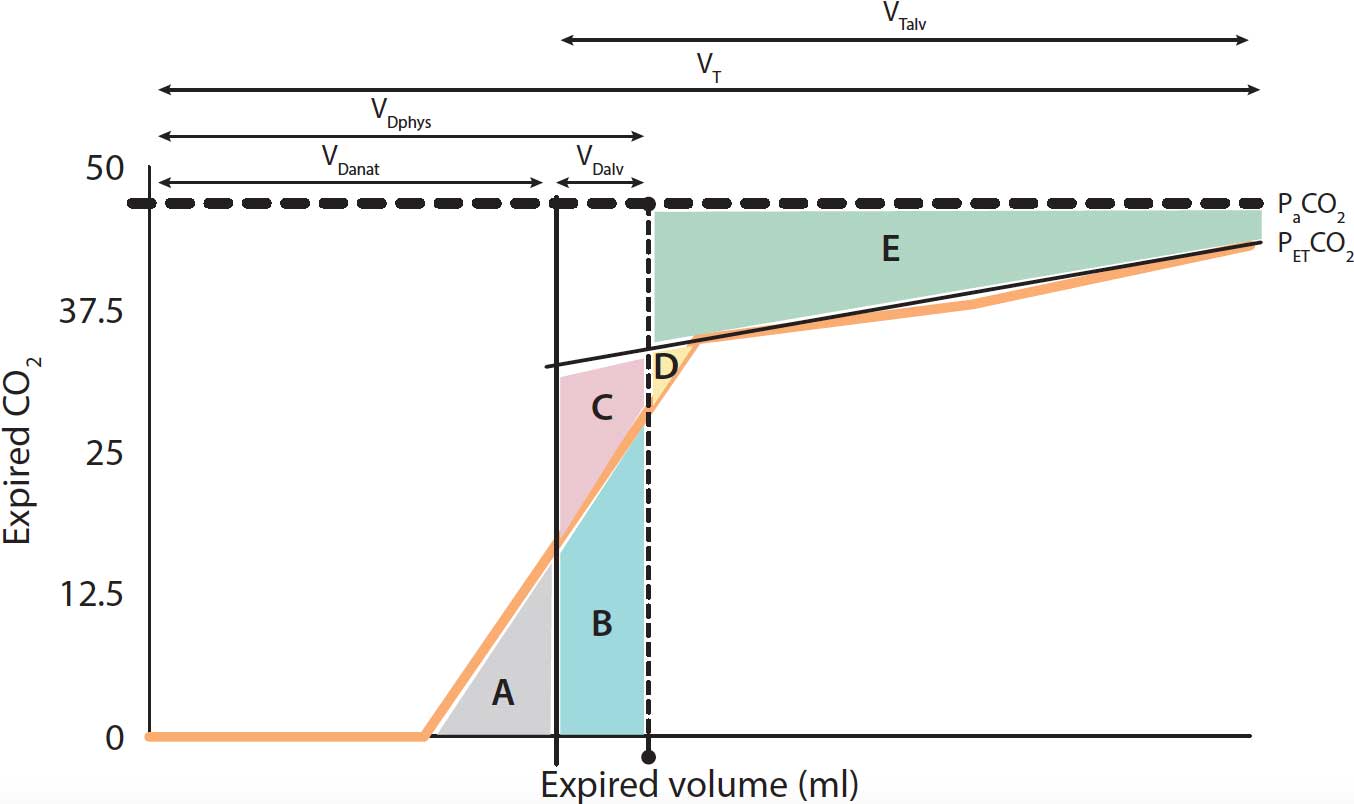
Dead space can be clinically expressed as an amount of breathing volume per unit of time (VD), as a fraction of a tidal volume (VD/VT), or as an absolute volume value during one respiratory cycle (physiological VD). Physiological VD is also divided as follows:
anatomical VD – the volume of air in the anatomical conducting airways
alveolar VD – the volume of gas within the alveoli that is ventilated, but an impaired perfusion exists
The Bohr’s equation is a formula to calculate the ratio of physiological VD to the tidal volume (VT):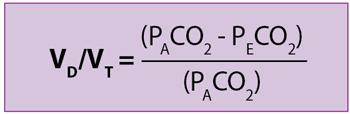
In the formula, PACO2 is the mean partial pressure of CO2 within the alveolar compartment and is calculated by the following equation:
K is a correction factor, V´CO2 is the metabolic production rate of CO2 and V´A is alveolar ventilation (V´A = [VT – VD] × respiratory rate).
PECO2 is the concentration of mixed expired CO2 and can be obtained from a Douglas bag or a mixing box located in the expiratory limb of the anaesthetic circuit.
Enghoff applied the concept of an ideal lung (all alveoli have a perfect ventilation [V]/perfusion [Q] matching) to the previous formula and, assuming PACO2 is equal to arterial tension of CO2 (PaCO2):
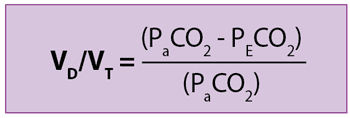
Healthy lungs under mechanical ventilation and pathological lungs are not ideal due to the likelihood of suffering shunt and increased dead space. PaCO2 increases once venous blood rich in CO2 passes through shunt areas (poorly or non‑ventilated alveoli), leading to an overestimation of the PACO2 and, therefore, of the physiological VD.
Although large fractions of shunt (lower than 20% to 30%) are needed to considerably interfere with VD calculations, the venous admixture influences the alveolar VD values.
Therefore, as Bohr’s equation provides true values of physiological VD with high to infinite V/Q alveoli, without being affected by venous admixture, Enghoff’s formula is an excellent global index of a lung’s efficiency of gas exchange.
While routine capnography plots the expired amount of CO2 on the y axis and time in the x axis, in the volumetric capnography (Vcap) CO2 raw data is related point by point to expiratory flow then integrated to obtain volume.
Vcap data is generated by the information obtained from a single breath monitored by a pneumotachograph and a mainstream or sidestream sensor located in an airway adapter (Figures 4 to 6).
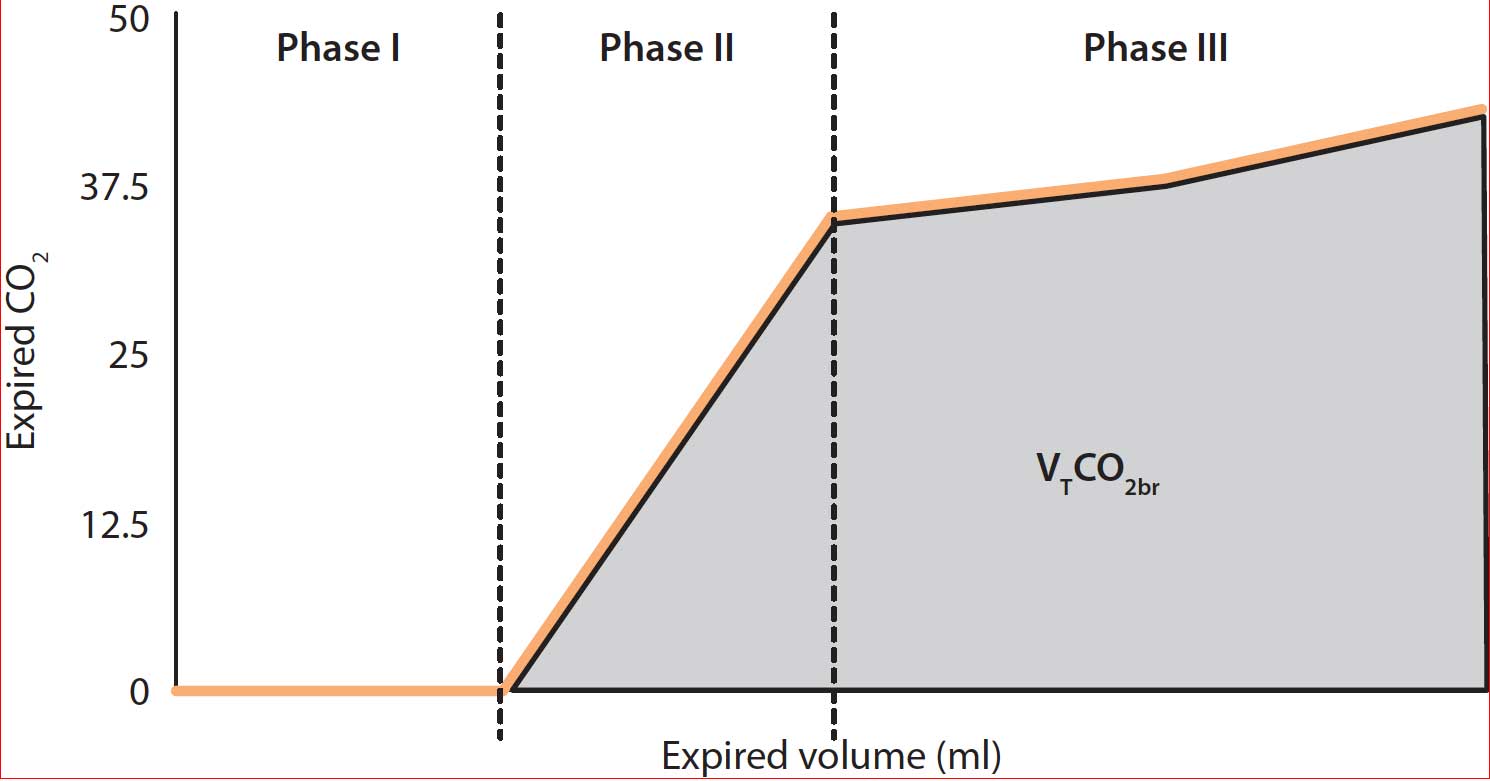
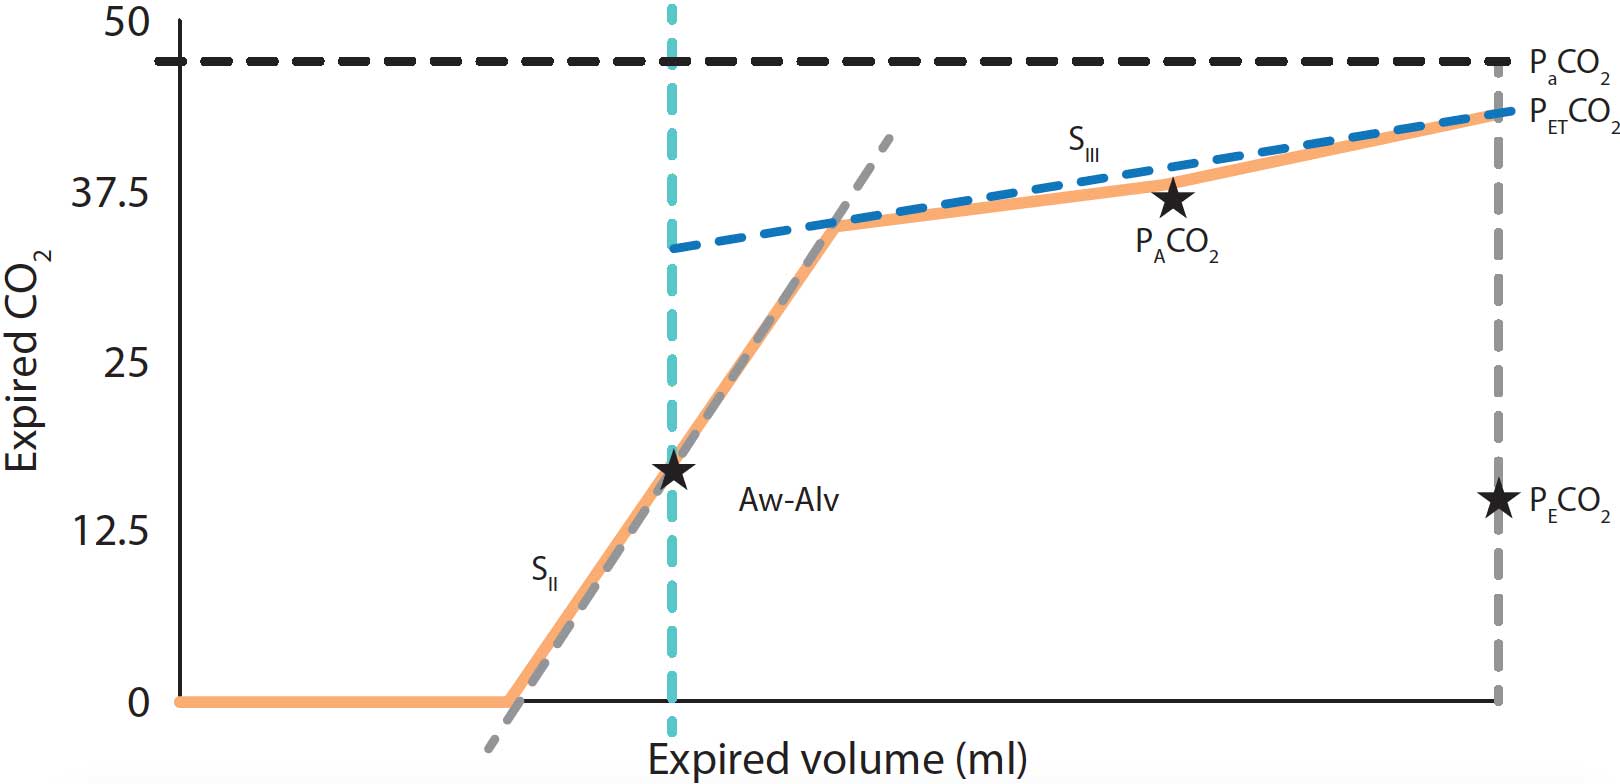
The main features and variables obtained by Vcap are:
Gas volumes are calculated assuming the sum of the different areas is: 1) A = C + D; 2) A + B = D + E (Figure 6).
Vcap in veterinary anaesthesia
Vcap has been shown to be a useful tool for VD measurement during canine anaesthesia (Mosing et al, 2010) and as a predictive method for bronchoconstriction in sedated dogs (Scheffzek et al, 2012). Additionally, a VT of 15ml/kg-1 showed less VD and higher VTalv compared to 10ml/kg-1 and 12ml/kg-1 measured by Vcap in healthy anaesthetised dogs (Bumbacher et al, 2017).
Promising results have been also noted in equine anaesthesia (Moens et al, 2014, Mosing et al, 2018).
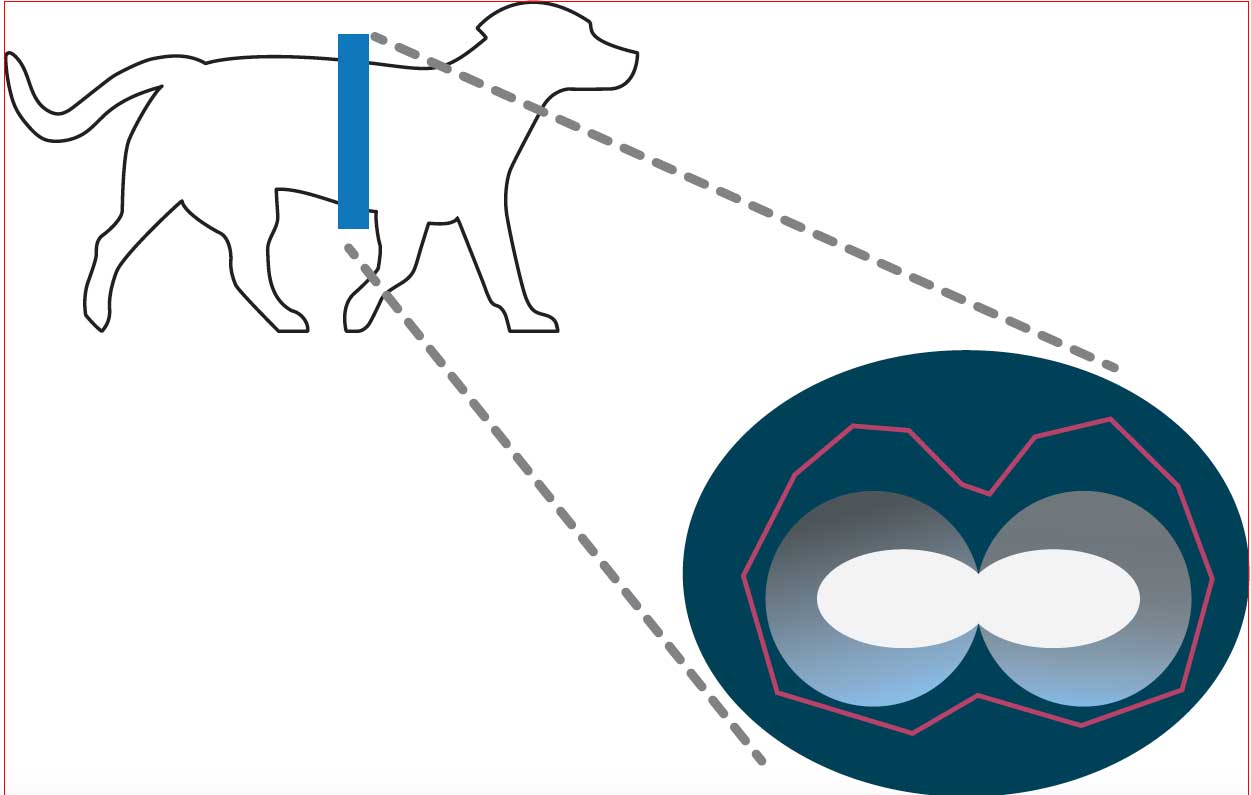
Electrical impedance tomography (EIT) is a non‑invasive and radiation‑free monitoring tool for assessment of alveolar lung function regional ventilation.
A belt with an array of electrodes is placed around the thorax and harmless alternating currents from two of theses electrodes are driven across the thorax in a circular pattern. The generated voltage is measured at the remaining electrodes and transformed into a two‑dimensional image of the distribution of the different electrical conductivities (impedance) changes within the thorax (Figure 7).
EIT has been proven as an applicable and reliable methodology for assessing lung ventilation in anaesthetised dogs in sternal recumbency (Gloning et al, 2017).
EIT has shown VT calculations with good correlation, when compared to spirometry, in mechanically ventilated healthy anaesthetised horses (Mosing et al, 2018). The application from the beginning of continuous positive airway pressure of 8cm H2O reduced the collapse of the alveoli and distributed the ventilation towards the dorsal dependent lung regions in healthy anaesthetised horses (Mosing et al, 2018).
Some drugs mentioned in this article are not licensed for veterinary use.