22 Aug 2016
Nic Ilchyshyn discusses methods of identifying lymphoid cancer cells and how investigations of flow cytometry can guide specific treatment and prognosis of diseases.
Nic Ilchyshyn
Job Title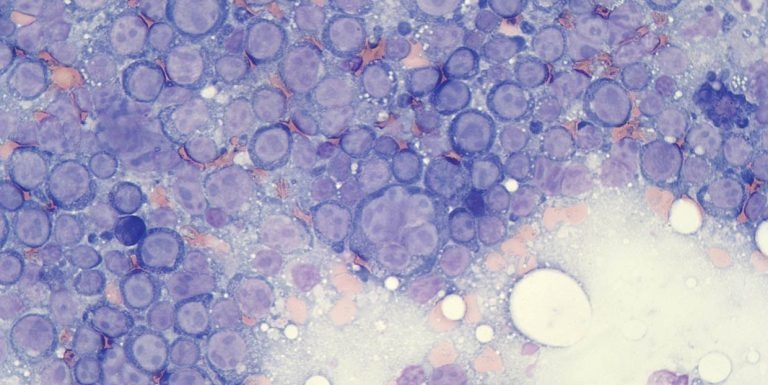
Figure 1a. Flow cytometry is most appropriate in aspirates where there is a prominent population of atypical cells, such as in aspirates labelled large cell lymphoma.
Lymphoma is a collection of cancers involving cells of lymphoid lineage. Depending on the type of cell and stage of development, lymphomas can have a very different biological behaviour and prognosis. Therefore, this tumour should not be considered a single condition and a diagnosis of “lymphoma” should prompt further investigation for sub-classification.
In human medicine, immunophenotyping with flow cytometry is an essential part of the diagnostic work-up for haematological malignancies. It is used to provide diagnostic information, as part of the criteria for World Health Organization lymphoma and leukaemia classification, and to access prognostic information.
In people, 60 to 80 different subtypes of non-Hodgkin lymphoma exist and the results of flow cytometry, combined with the results of cytological and histological examination, are used for classification.
Immunophenotyping by flow cytometry is being increasingly used in veterinary oncology in the diagnosis and investigation of canine lymphoma and leukaemia. Although an equivalent extensive set of antibodies, as used in human medicine, is not yet available, the classification of canine lymphoma by immunophenotyping with flow cytometry can provide additional information that can guide treatment and prognosis.
This article will consider the use of flow cytometry in the diagnostic work-up of canine lymphoma.
Immunophenotyping involves identifying the proteins (antigens) present on the surface or within the cytoplasm of a population of cells. These antigens are classified using the cluster of differentiation nomenclature (CD) and the expression of certain antigens can be specific to a particular lineage of cells, or to cells of a certain stage of development (precursors or mature cells; Table 1).
| Table 1. Cluster of differentiation antigens and the types of cells that express them | |
|---|---|
| CD antigen | Cells that express antigen |
| CD3 | T-lymphocytes. |
| CD4 | Helper T-lymphocytes, canine neutrophils and neutrophil precursors. |
| CD5 | T-cell precursors and mature T-cells, subset of B-cells, including early precursors. |
| CD8 | Cytotoxic T-cells, large granular lymphocytes. |
| CD11d | Large granular lymphocytes and subset of monocytes. |
| CD14 | Monoblasts and mature monocytes. |
| CD21 | Mature B-lymphocytes. |
| CD79a | B-cells, including early precursors. |
| CD34 | Stem cells and early committed myeloid and lymphoid progenitors in acute leukaemia. |
| CD45 | All leukocytes, strongest on lymphocytes, weakest on granulocytes. |
| MHCII | Canine B-lymphocytes and T-lymphocytes, and antigen-presenting cells. |
| CD = cluster of differentiation, MHCII = major histocompatibility complex class II. | |
In the case of lymphoproliferative disease, identification of these antigens assists with the sub-classification of lymphoma and may reveal the presence of aberrant expression of antigens that could have a prognostic significance.
Antibodies that bind to epitopes on specific CD antigens have been developed. The antibodies are labelled with fluorochromes to facilitate detection.
Fluorochromes are chemicals that emit light of a specific wavelength when stimulated by a light source. The fluorochrome can either be directly conjugated on to the CD-specific antibody (direct staining) or can be conjugated to a secondary antibody specific to the fragment crystallizable region of the CD-specific antibody (indirect staining).
Many fluorochromes are available, but the most common used in diagnostic flow cytometry are fluorescein isothiocyanate (FITC) and phycoerythrin (PE). These molecules are both stimulated by light with a wavelength of 488nm, which is the wavelength of light emitted by a blue laser, and then emit light at 500 nanometres (nm; green) and 575nm (yellow), respectively.
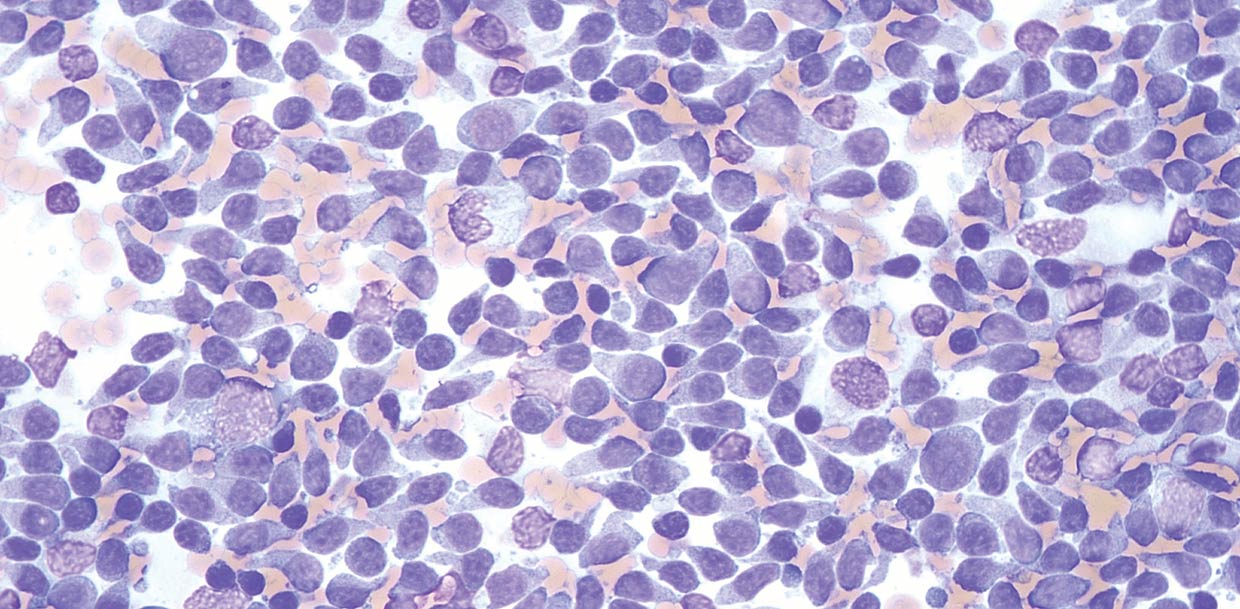
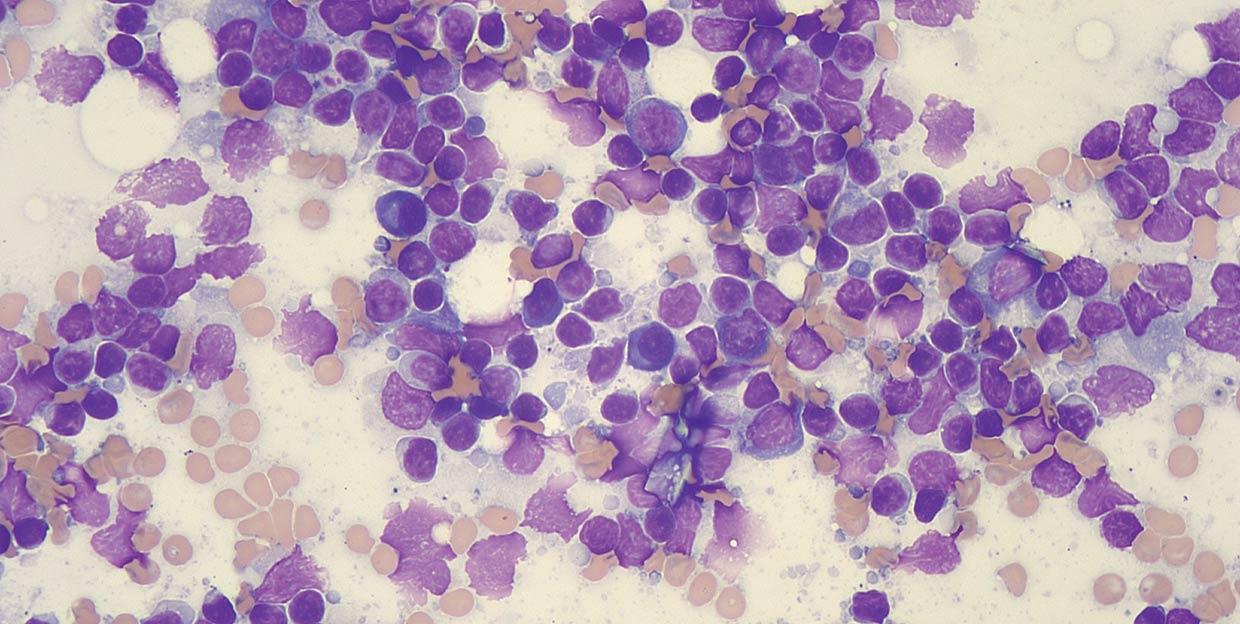
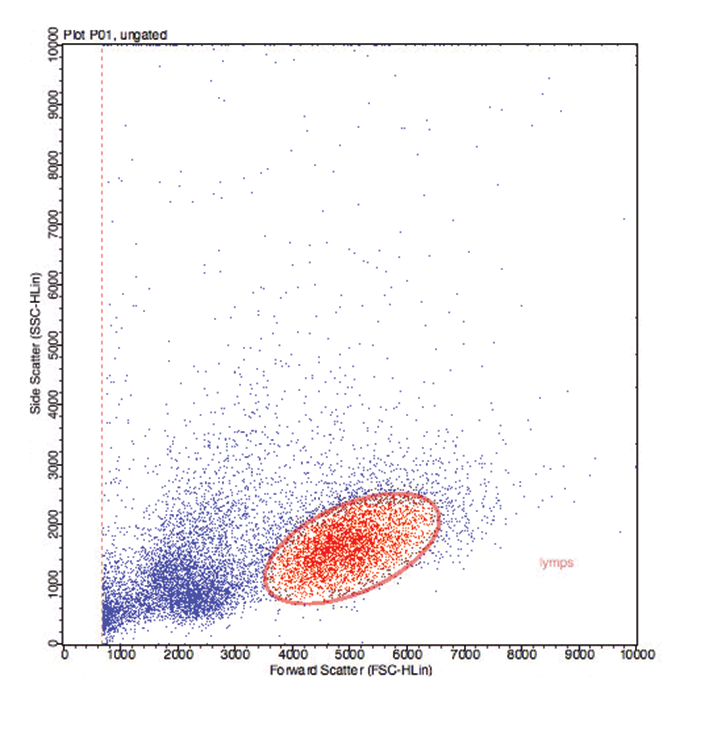
Flow cytometry is most appropriately performed on samples containing a high number of neoplastic cells, or at least where the atypical population can be identified and distinguished from other cells based on their morphological features (size and internal complexity; Figure 1).

In samples where the cell population is mixed or only a low number of neoplastic cells exist, such as T-cell-rich B-cell lymphoma (Hodgkin-like lymphoma), flow cytometry results may be inconclusive.
Flow cytometry does not, and cannot, replace standard methods of investigation of lymphoproliferative disease, such as cytology or histopathology, and should primarily be used to immunophenotype lymphoma once a confident diagnosis has been achieved. Morphological evaluation of the cells by cytology or histopathology is still required for lymphoma grading and to assess the proportions of the populations of lymphocytes and other cells present to aid in the interpretation of flow cytometry results.
Flow cytometry can assist in differentiating a reactive lymphadenopathy from small cell lymphoma by demonstrating a monomorphic population of one immunophenotype (such as all B-cells), as opposed to a reactive node, where a mixed population of B-cells and T-cells would be expected.
In some lymphomas, an abnormal pattern of antibody staining exists, which helps confirm the diagnosis of lymphoma. Demonstrating cells all express the same immunophenotype does not prove they are genetically clonal. This is tested for using the PCR for antigen receptor rearrangement (PARR) technique, and is sometimes required when flow cytometry results are equivocal.
To perform flow cytometry, cells must be suspended within a fluid medium. Cells in blood, CSF and effusions can be analysed directly from a sample placed in ethylenediaminetetraacetic acid (EDTA).
For lymph nodes, the cells are mixed with a fluid media, creating a cell suspension. Several aspirates from a lymph node, taken by redirecting a needle inserted into the node a few times (with or without suction), are expelled either into flow cytometry media or a mixture of saline and EDTA plasma.
Often, three to six aspirates are required to collect a sufficient number of cells to permit analysis of a full panel of antibodies and the appropriate controls. When collecting samples for flow cytometry, it is imperative to collect additional samples for cytology (aspirate smears), as cell morphology is not well preserved when cells are suspended in liquid.
As flow cytometry uses unfixed cells, the technique is vulnerable to problems with sample ageing leading to alterations in receptor expression, epitope configuration and cell longevity. Ideally, flow cytometry samples should be analysed in 24 hours of collection, although diagnostic results may still be possible beyond this time. If a delay is anticipated, the suspension can be placed in a flow cytometry fixative.
In the laboratory, the sample is separated into aliquots (typically containing 500,000 cells) and each aliquot is stained with one (single staining), two (dual staining) or three (triple staining) CD antigen-specific antibodies, with each conjugated to a different coloured fluorochrome. For intracellular antigens, the cells are permeabilised to allow the antibodies access to the interior of the cell. Following staining, unbound antibody is washed away and any contaminant erythrocytes are lysed prior to analysis.
Flow cytometers interrogate individual cells, which flow in a single file stream between a light source and several photodetectors (flow cell; Figure 2). The photodetectors transform the detection of light into electrical signals. They are arranged to collect data on the forward and side scatter of light as a result of the cell’s size and internal complexity, respectively. This enables differentiation of lymphocytes, polymorphonuclear cells (neutrophils and eosinophils) and monocytes/macrophages, but also different sized sub-populations.
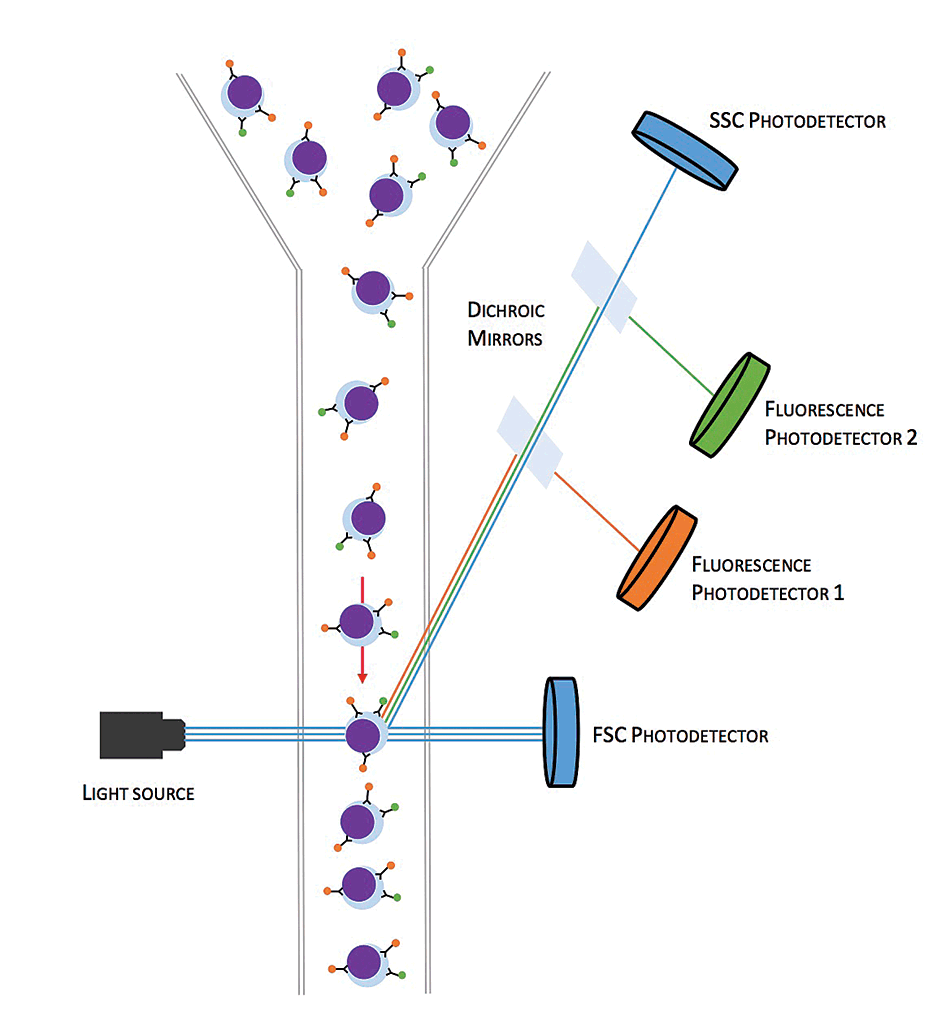
Photodetectors exist that specifically detect photons of a particular wavelength emitted by bound fluorochrome conjugated antibodies. As each cell passes through the flow cell, data on the size and complexity of the cell is recorded, as well as any associated fluorochrome light emission indicating bound CD antigen antibody.
Initially, the results of each cell (event) can be presented in a scatter plot comparing the forward scatter against side scatter (Figure 3a). This allows the cells to differentiated into different populations and a particular population of cells can be selected (gated). The gating of the cell population of interest may be guided by the results of cytological examination of lymph node aspirates. The CD antigen expression on the gated cells is analysed without the confusion of the fluorochrome expression data of the other cells.
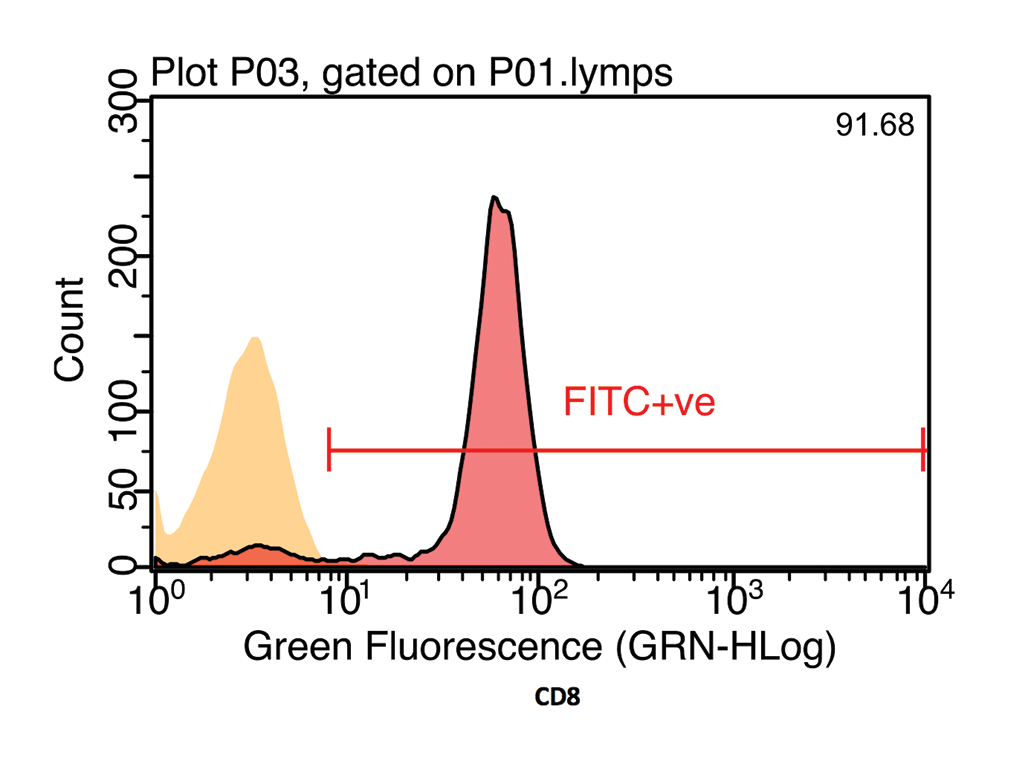
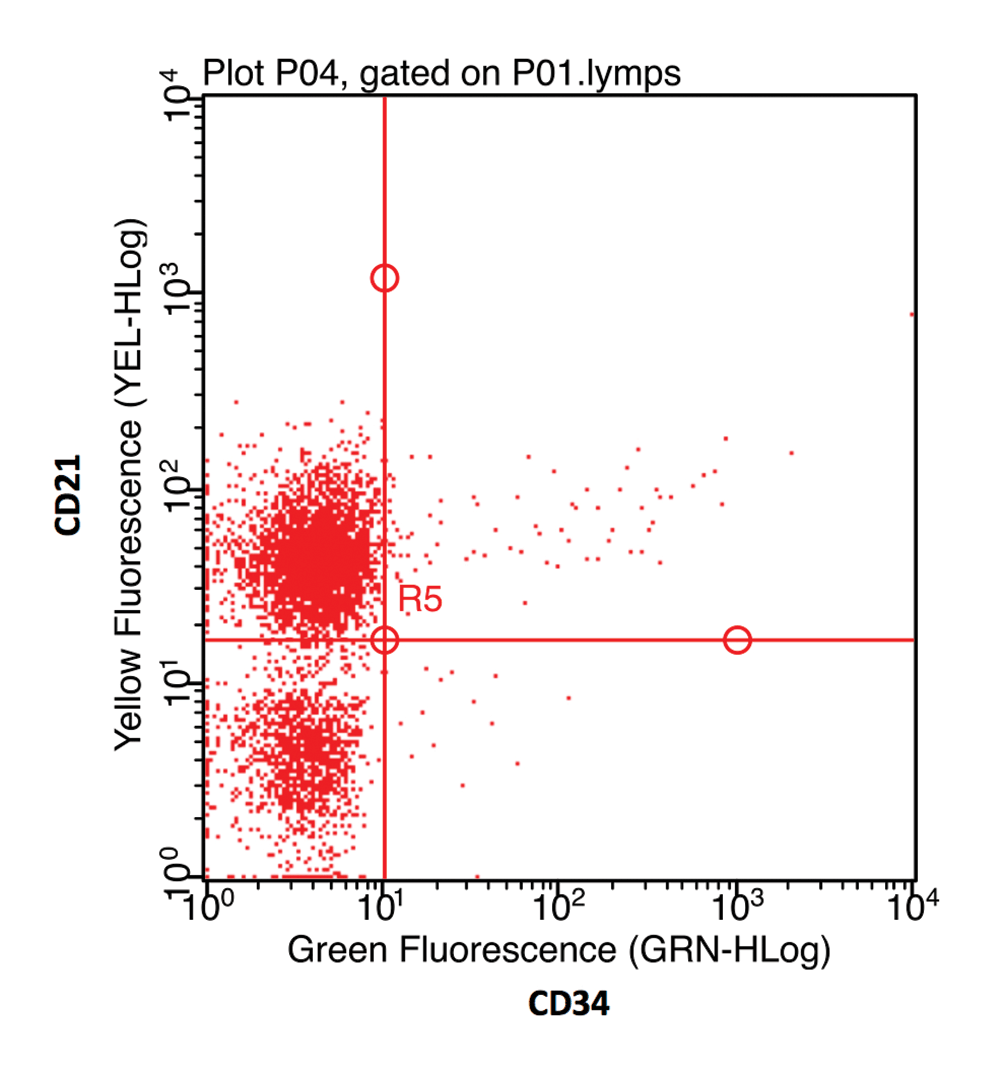
The fluorochrome data may be presented as a histogram of the distribution of cells to fluorescence intensity (Figure 3b). When dual staining is performed, a scatter plot of the fluorescence of each fluorochrome can be used to identify cells staining for each receptor individually, as well as cells that co-express both CD antigens (Figure 3c).
By evaluation of the fluorescence results for each fluorochrome, in all the aliquots, and comparison of the fluorescence results with isotype (negative) controls, the antigen expression of the population of cells can be determined.
Lymphomas can be divided into B-cell and T-cell disease. In most breeds of dog, B-cell lymphoma is seen more commonly than T-cell lymphoma. However, in some breeds, such as the boxer, spitz and shih-tzu, T-cell lymphoma is reported more frequently (Lurie et al, 2008; Modiano et al, 2005). The most common B-cell subtype is the large diffuse B-cell lymphoma, which expresses the B-cell markers CD21, major histocompatibility complex class II (MHCII) and CD79a.
In the case of T-cell lymphoma, several different subtypes can be seen and immunophenotype results are more varied. High-grade T-cell lymphoma is often reported to have a poorer prognosis than the equivalent grade B-cell disease (Ponce et al, 2004) and some oncologists will select different chemotherapy regimes depending on the subtype (Elliot, 2015).
Neoplastic cells do not always exhibit their expected markers. On occasion, neoplastic cells may not express or have reduced expression of these markers, or express markers not typical of their lineage. In humans, aberrant expression can sometimes be associated with a poorer prognosis (Jennings and Foon, 1997).
In animals, understanding of the prognostic implications of all combinations of aberrant marker expressions has not been fully established. However, in B-cell lymphoma, the loss of expression of MHCII is associated with a poorer prognosis (Rao et al, 2011). Around 10% of B-cell lymphomas may also express CD34, which, in leukaemia, indicates acute disease and a poor prognosis (Williams et al, 2008), but does not appear to effect prognosis in lymphoma (Rao et al, 2011).
Although T-cell lymphomas generally regarded as an aggressive disease, a subset of CD4+ T-cell lymphomas has a more indolent course (Avery et al, 2014). This less aggressive disease, which is histologically described as T-zone lymphoma, had cells that have aberrant reduced or absent expression of the pan-
leukocyte marker CD45, and express MHCII and CD21 (Seelig et al, 2014).
The detection of aberrant receptor expression is diagnostic for lymphoma, making flow cytometry a useful technique where the cytological diagnosis is uncertain, avoiding the requirement for invasive surgical biopsy. In some cases, there is aberrant expression, or lack of expression, of both B-cell and T-cell markers. In these cases, it can be difficult to discern whether the lymphoproliferative process is of B-cell or T-cell origin, and evaluation of clonality of the PARR may be required to definitively identify a lineage.
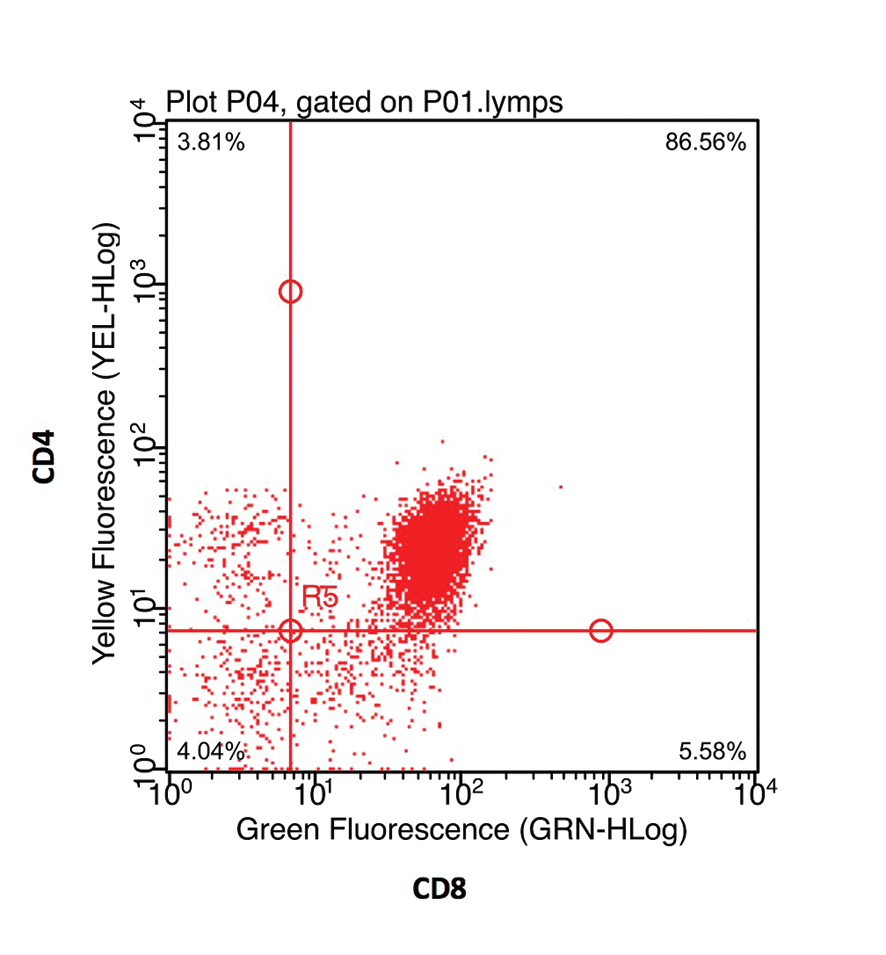
Flow cytometry can also be helpful in the investigation of mediastinal masses. Small cell lymphoma and lymphocyte-rich thymoma can be indistinguishable on cytology; however, the treatment options for these tumours are very different. The detection of more than 10% of small lymphocytes co-expressing CD4 and CD8 is highly supportive of thymoma (Lana et al, 2006; Figure 4).
Lymphoma is a commonly encountered neoplasm seen in dogs that has conventionally required surgical biopsy with histopathology and immunohistochemistry for further classification.
Flow cytometry has many advantages and is a minimally invasive procedure that can rapidly provide clinically useful diagnostic and prognostic information.