16 May 2016
Elisabetta Mancinelli looks at the anatomical and physiological peculiarities of domestic rabbits, compared to more traditional species, and why they need to be known to ensure they are dealt with safely and more efficaciously.
Elisabetta Mancinelli
Job Title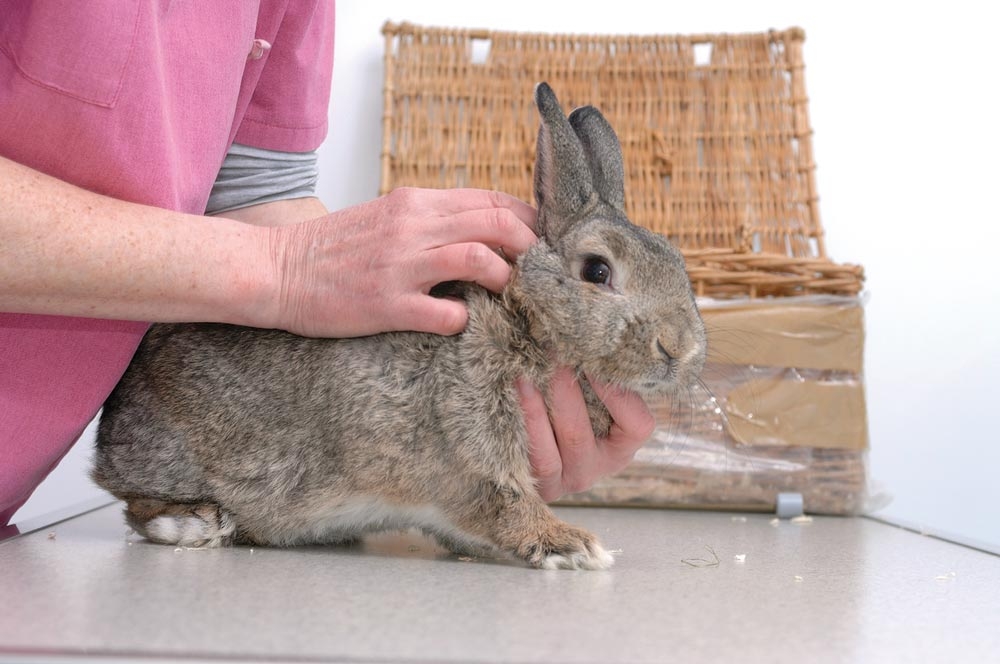
Fear and stress from handling may be responsible for glucose levels up to 15mmol/L (270mg/dL) in healthy rabbits. Image: © Fotolia/Antoine-photographe.
Rabbits have become the third most common mammalian pet in Europe and the US, and the standards of care of this unique species have certainly improved over the past decade.

The anatomical and physiological peculiarities of domestic rabbits, compared to more traditional species, need to be known to ensure they are dealt with safely and more efficaciously. Rabbits have a high metabolic rate; they are hindgut fermenters with a unique calcium metabolism and a peculiar feeding strategy that allows them to introduce large amounts of fibrous food and rapidly eliminate the waste from their body – allowing them to rapidly escape predators.
Being prey species, rabbits are also masters at disguising signs of disease and are extremely sensitive to stress. These characteristics make them more vulnerable compared to more traditional species, such as dogs and cats, especially in critical situations (Fisher, 2010; Schepers et al, 2009).
However, especially in these situations, identification of negative prognostic factors would allow the clinician to promptly start, and better target, the medical intervention – increasing the chances of a positive outcome.
Several prognostic factors have been identified for domestic rabbits and this article aims to review latest research on this topic.
Rabbits are prone to rapid changes in body temperature because of their high surface area to volume ratio (Hull, 1965). Empirical values comprised between 38°C and 40°C have been considered normal in domestic rabbits (Harcourt-Brown, 2002; Varga, 2014), but an actual reference range has yet to be published and it is likely to be affected by multiple factors (Di Girolamo et al, 2016).
The clinical value of measuring the rectal temperature has been criticised over the years and considered not helpful in making a diagnosis (Richardson, 2000), and of limited importance due to difficulty interpreting its significance and associated risks of stress and trauma to the rectal mucosa (Varga, 2014).
More recently, Di Girolamo et al (2016) found rectal temperature was easily measured in client-owned rabbits and a relevant prognostic factor. Hypothermia was, in fact, associated with increased mortality in pet rabbits presented in critical conditions and considered a major predictor of death. Therefore, rectal temperature should always be measured during every physical examination.
The authors found hypothermia in healthy rabbits that did not show any signs of disease (for example, patients undergoing elective surgery) was also associated with increased mortality, suggesting determination of rectal temperature could be used as a screening tool in healthy individuals as well. The mechanism by which temperature is associated, with reduced chances of survival, may vary.
Hypothermia may represent a response to stress, an early decompensatory stage of shock, but may actively decrease chances of survival by depressing cardiac function and contributing to poor perfusion and myocardial irritability with secondary arrhythmias – ultimately affecting multiple organ systems and physiologic processes. It is important to emphasise hypothermia is linked to an increased risk of death, but does not ultimately cause death.
Hypothermia may indicate the severity of disease and should be treated (Lichtenberger and Lennox, 2012), but it remains to be determined whether aggressive or passive rewarming procedures are to be preferred (Vassal et al, 2001). Consideration should also be given to the fact high environmental temperatures may have a negative impact on metabolism and bacterial flora in rabbits (Amici et al, 1998).
Published reference intervals for normal blood glucose in rabbits fall between 4.2mmol/L to 8.2mmol/L, with slight differences between sources (Campbell, 2004; Jenkins, 2006). Little information exists about abnormalities in blood glucose in relation to clinical disease in rabbits, although they are used in experimental studies into glucose homeostasis (Dimitrova et al, 2008).
Clinical observation that critically ill rabbits can have very high blood glucose levels (greater than 20mmol/L) prompted a study to investigate blood glucose levels in pet rabbits and its association with poorer clinical outcomes (Harcourt-Brown and Harcourt-Brown, 2012). Data from 907 rabbits with and without clinical disease were analysed to investigate the hypothesis blood glucose is an easily measurable parameter that may be used as a prognostic indicator and assist in decision making between intestinal obstruction and gut stasis, if used alongside continued clinical evaluation of the patient and diagnostic imaging.
The results showed the mean blood glucose concentration of rabbits with confirmed gut stasis was 8.5mmol/L, compared with a mean value of 24.7mmol/L in rabbits with confirmed intestinal obstruction. Blood glucose levels above 20mmol/L were also only seen in rabbits with life-threatening diseases (for example, enterotoxaemia, mucoid enteropathy, hepatic lipidosis, bladder obstruction, ureteral stones or intestinal obstruction). Rabbits suffering from these diseases were anorexic and their stress levels probably accounted for the interaction between anorexia, stress level and hyperglycaemia.
These results also suggested the degree of hyperglycaemia may be a predictor of life-threatening disease in rabbits, although the exact mechanism for this remains unclear and further studies would be required to clarify the process behind hyperglycaemia in critically ill rabbits.
Hyperglycaemia is a recognised response to critical illness in many species, including humans (Cely et al, 2004; Nasraway, 2006) and dogs (Torre et al, 2007), and it is often used as a prognostic indicator in some conditions, for example, following traumatic injuries or in stroke patients. The degree of hyperglycaemia reflects the stress response and is a predictor of outcome in people (O’Neill et al, 1991). In veterinary medicine, hyperglycaemia is common in horses with abdominal disease and is associated with a poor prognosis (Hollis et al, 2007; Hassel et al, 2009).
Limitations of this study should be taken into consideration and include the fact glucose results were obtained using a portable blood glucose meter (Accu-Chek), which is designed for use in humans and not validated for use in rabbits. Also, no comparison was made between the results obtained and reference laboratory-based methods.
Sodium is the most abundant extracellular cation in the body and largely responsible for plasmatic osmolality together with other solutes that remain mainly in the extracellular fluid (ECF), such as glucose or urea (Di Bartola, 2012). Hyponatraemia represents the most common electrolyte abnormality in hospitalised humans and the decrease in sodium levels becomes pathologic when it leads to a state of hypotonicity of the ECF with tendency of free water to move into the intracellular space (Laczi, 2008). The main side effects occur in the nervous system, due to the risk of cerebral oedema, and symptoms depend on the rate of development and the degree of hyponatraemia, ranging from mild depression to stupor, convulsions, coma and death.
Based on plasma tonicity, we can distinguish two types of hyponatraemia:
Because the plasma tonicity is maintained within specific physiologic limits, sodium plasma levels decrease when glycaemia increases (pseudohyponatraemia). Therefore, the interpretation of natraemia value should also take into consideration the glycaemia value and the plasma tonicity. Pseudohyponatraemia (isotonic or hypertonic) has no consequences for the patient’s health, whereas true hyponatraemia is a serious clinical condition that must be correctly diagnosed and treated.
A recent retrospective study determined 136mEq/L to 147mEq/L as the physiological range of sodium in pet rabbits, measured using whole blood in lithium heparin with EC8& cartridges for iStat-1 analyser. These values are slightly different from other published ranges, so the lower limit proposed by different authors can vary up to 8mEq/L from one to another literature source (Bovehi et al, 2014).
Blood urea nitrogen and glucose levels were also determined and found similar to previous reports. Fear and stress from handling may be responsible for glucose levels up to 15mmol/L (270mg/dL) in healthy rabbits (Dontas et al, 2011; Harcourt-Brown and Harcourt-Brown, 2012). Mild dehydration may occur even during transportation of a rabbit to a veterinary clinic. These changes may cause mild hyperglycaemia and azotaemia in these animals. However, they appear to have no effect on the sodium levels and tonicity in healthy individuals in the study presented.
Based on the results, the authors suggested hyponatraemia and hyperglycaemia appear to be common in ill pet rabbits, and both true hyponatraemia (hypotonic hyponatraemia) and pseudohyponatraemia (isotonic hyponatraemia) can be encountered in a clinical setting. Sodium plasma levels in rabbits decrease in conditions of hyperglycaemia and a drop of 2.9mEq/L of sodium concentration would be expected for every 5.5mmol/L (100mg/dL) increase in glucose concentration in rabbits.
Further research is required to verify if the reverse is also true, that is, if glucose levels may rise as a compensatory mechanism to hyponatraemia due to gastric stasis, digestive obstruction, diarrhoea, liver disease, congestive heart failure, septicaemia, nephrotic syndrome, pancreatitis, diuretic administration or other conditions.
Harcourt-Brown and Harcourt-Brown (2012) reported poor prognosis in severely hyperglycaemic rabbits and outlined a correlation between digestive obstruction and severe hyperglycaemia. Minding the association between plasmatic sodium and glucose, this finding is consistent with the results of this study, which showed hyponatraemia is also associated with increased mortality.
Rabbits with plasma sodium concentration lower than 129mEq/L had a 2.3-fold increase in mortality. However, simultaneous determination of sodium and glucose concentrations, and calculation of the plasmatic tonicity (using the formula described in the aforementioned paper), should be performed when evaluating a clinically ill rabbit patient.
Recent research states L-lactate concentrations in rabbits are higher than in other species (Stangassinger et al, 1982; Vernay, 1987). L-lactate and D-lactate concentrations have been assessed in pet rabbits (Shrawtz et al, 2006; Langlois et al, 2014). The metabolism of lactic acid is entirely different and much higher concentrations can be reached in rabbits compared to other species. The clinical relevance (diagnostic and prognostic value) of plasmatic L-lactate concentration was recently explored in pet rabbits (Ardiaca et al, 2016).
Researchers found the current dogma that low plasmatic L-lactate concentration has no clinical relevance, while high concentration is associated with disease and mortality, is not applicable in ill rabbits. The reference interval for plasmatic L-lactate concentration was 2.1mmol/L to 15.2mmol/L in healthy pet rabbits, showing a much wider range compared to other species, but demonstrating a non-normal bimodal distribution likely due to the effect of caecotrophy.
Single on-arrival measurement of plasma L-lactate had poor diagnostic or prognostic value in this species. However, a sudden increase in L-lactate concentrations with concurrent metabolic acidosis in an anorexic rabbit should alert the clinician as a probable marker of metabolic distress. Serial measurement over 48 hours might have a prognostic value. Critically ill rabbits tended to have persistently lower and less fluctuating levels, resulting in an overall significantly decreased L-lactate production over 48 hours compared to controls or survivors, while a good prognosis was associated with an increase in plasma L-lactate levels.