13 Apr 2015
Louise O'Dwyer
Job Title
Figure 2. Sidestream capnometer port.
Since 1943, when Karl Luft introduced the first infrared carbon dioxide (CO2) measuring and recording device, capnography has become an essential part of monitoring anaesthetised and critical care patients.
(Barter, 2012)
Since that time, other methods of measuring end-tidal CO2 (ETCO2) have been documented – for example, laser-based molecular correlation spectrography and Raman spectroscopy; magnetic-based mass spectrometry; and photoacoustic spectroscopy – however, infrared technology remains the most compact, least expensive and most popular method of ETCO2 measurement.
Capnography provides a non-invasive method that permits the assessment of the adequacy of patient ventilation, systemic metabolism, cardiac output and pulmonary perfusion in a variety of clinical situations, such as during anaesthesia, when effects of drugs and inhalants are likely to cause respiratory depression, or during long-term ventilatory assistance, as with the use of a mechanical ventilator.
Normal ETCO2 values, in non-anaesthetised patients, are 35mmHg to 45mmHg. ETCO2 values above 50mmHg indicate inadequate ventilation and ventilatory assistance via manual or mechanical means may be required. The highest ETCO2 permissible should be 60mmHg.
Capnography is also superior over pulse oximetry for the prompt identification of apnoea and airway issues, since changes in the percentage of haemoglobin saturated with oxygen will be delayed as compared to the instantaneous changes that occur with ETCO2 when the next breath fails detection. When alveoli are not perfused, CO2 is unable to diffuse out of the bloodstream, but as blood flow improves and alveoli are perfused, CO2 can then be excreted. Therefore, an abrupt decrease in ETCO2 can be an early and reliable indication of an impending cardiovascular collapse or cardiac arrest.
Since delivery of CO2 from the lungs requires blood flow, cellular metabolism and alveolar ventilation, the presence of ETCO2 can also be used to assess the effectiveness of cardio-pulmonary cerebral resuscitation efforts (Jandrey, 2006).
CO2 is transported in the body in three forms: after conversion in the red blood cells, 60% to 70% is transported as bicarbonate ion, another 20% to 30% is transported while bound to proteins and the remaining 5% to 10% is dissolved in plasma. The latter is what is actually measured during blood gas analysis and is known as the arterial partial pressure of CO2 (PaCO2).
ETCO2 is the result of expired gases from the alveoli. The site of gas exchange occurs in the alveolar capillary beds lying between the blood and air within the lungs. Under normal circumstances, ETCO2 typically underestimates the PaCO2 by a clinically insignificant 2mmHg to 5mmHg.
Therefore, because of the extremely close proximity of gas exchange between the alveoli and pulmonary capillaries, ETCO2 is approximately equal to PaCO2 that is, approximately equal to alveolar CO2 (Reuss-Lamsky, 2010).
ETCO2 is the partial pressure of CO2 in the expired air obtained at the end of expiration. This value approximates that of alveolar air, assuming:
ETCO2 is a product of three major determinants:
ETCO2 can therefore provide information regarding metabolism, circulation and ventilation.
Most capnographs used in clinical monitoring use infrared absorption spectroscopy to determine the concentration of CO2 in the expired air.
Infrared light, at wavelengths absorbed by CO2, is passed through the expired gas sample and the concentration is determined according to the Beer-Lambert law.
Capnography is a much more straightforward technology than pulse oximetry in that the sample is removed from the patient and is not subject to corrections for the patient’s background interference (Jandrey, 2006).


Capnometry is the measurement of CO2 at the airway opening during the ventilatory cycle (PETCO2). The capnometer displays the numerical value for the partial pressure of CO2 (PCO2). Capnography is the waveform display of CO2 as a function of time or volume.
A device that measures CO2 and displays a waveform is a capnograph. The waveform displayed by a capnograph is called a capnogram. Capnometers may use infrared (most common), Raman scattering, mass and colorimetric spectroscopy for measurement of CO2.
Mainstream or sidestream capnometry describes the location of the measurement chamber or airway sampling site.
Mainstream capnometers place the measurement chamber within the airways. This allows for an almost instantaneous measurement of CO2. Some drawbacks of mainstream capnometry include:
Sidestream capnometers sample air aspirated out of the airway through fine bore tubing to a measurement chamber outside the device (Figure 2).
An advantage of sidestream analysis is the units often measure other gases (that is, oxygen and anaesthetics). Slight delays in measurement may occur due to movement of the sample through the tubing. Secretions from the airway may easily obstruct the tubing.
Neither is clearly superior and the choice between them is most often a personal preference.

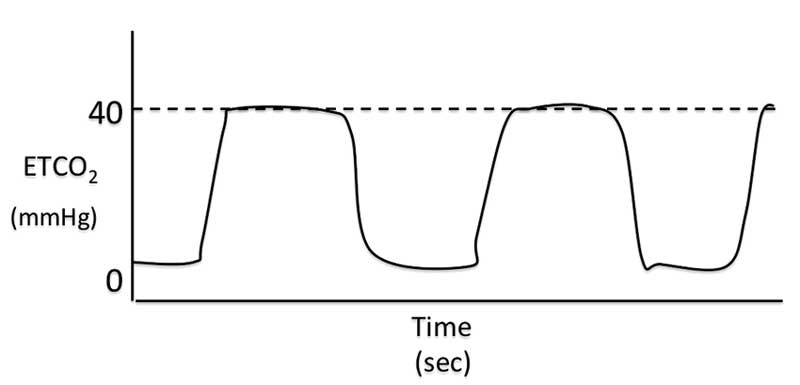
The normal capnogram (Figure 3) can be divided into four main phases:
Phase one is normally the flat baseline segment of the capnogram. The first part of this phase is when inspiration occurs. At the end of this phase, the direction of gas flow reverses as expiration occurs.
During early expiration, the exhaled gas comes from anatomic dead space; this gas has not undergone any gas exchange and, as a result, the gas from this area is identical to inspired gas (that is, contains no CO2).
Phase two is the upstroke of the waveform. This corresponds to the part of exhalation where CO2 containing alveolar gas starts to be exhaled in a mixture with gas from the anatomical dead space.
As expiration continues, the expired gas is composed of rapidly increasing proportions of alveolar gas, and the CO2 levels quickly begin to rise.
This phase is the plateau of the capnogram. At this point, PCO2 is normally almost constant as alveolar gas is exhaled. Expiration ends partway through this phase and is usually followed by a pause.
During this pause, PCO2 normally remains constant on the capnogram, despite the fact there is no gas flowing in or out of the patient. This is because there is expired alveolar gas remaining stationary within the region of the breathing circuit from which the gas is being sampled.
This part of the plateau may be cut short by small tidal volumes, high fresh gas flow rates and/or high gas sampling rates. The angle between phases two and three of the capnogram is known as the alpha angle and is normally about 100° to 110°.
Phase four is the rapid downstroke on the capnogram that corresponds with inspiration. During this phase, fresh inspired gas (which should be CO2-free) passes the sampling port as it is inspired into the lungs.
The angle between phases three and four is known as the beta angle and is normally about 90°.
Aberrations in the capnographic waveform may occur. Therefore, it is important to read the PETCO2 and also assess the capnogram.
If the capnogram does not return to baseline during inspiration and this is not thought to be due to a slow response time of the analyser (that is, the waveform is a normal shape) then the patient must be inhaling CO2.
Common reasons for this abnormality include inadequate fresh gas flow rates when using non-rebreathing systems (for example, Bain system), exhausted CO2 absorbed within rebreathing system (for example, circle system) or a malfunctioning inspiratory valve in a circle system (Figure 4).
When using sidestream capnographs, gas sampling rates can affect the rate of the capnogram. Slow sampling rates will decrease the slope of phase two, shorten the alveolar plateau and decrease the slope of phase four. This delay in response time will commonly cause an increase in the alpha and beta angle of the capnogram.
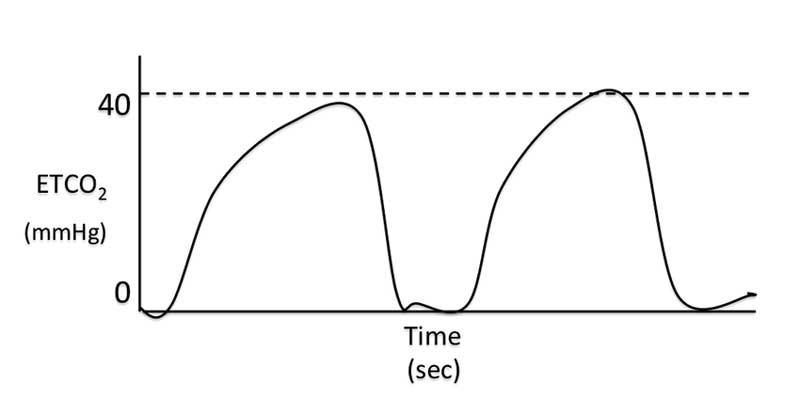
If the slope of phase two is decreased in the absence of delayed equipment response time, it suggests a slow expiration time. Causes of slow expiration include partially obstructed (for example, mucus plug) or kinked endotracheal tubes, physical conditions that cause a narrowing of the airway (Figure 5).
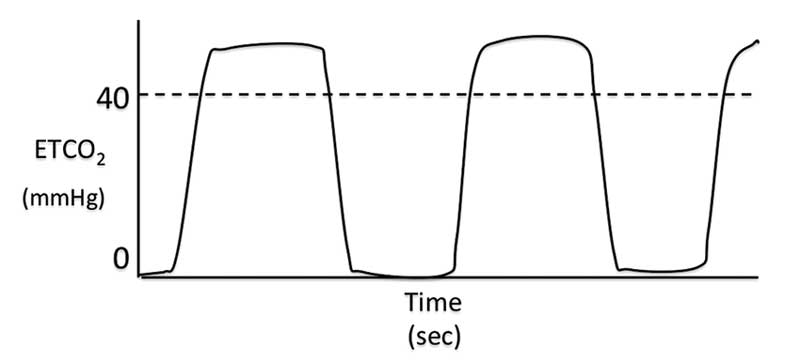
In healthy, conscious patients, peak expiratory ETCO2 values are only a few mmHg lower than PaCO2. A normally shaped capnograph with an elevated alveolar plateau indicates hypoventilation (Figure 6). In anaesthetised or sedated patients this is not an uncommon finding and it can be common cause of hypoxaemia.
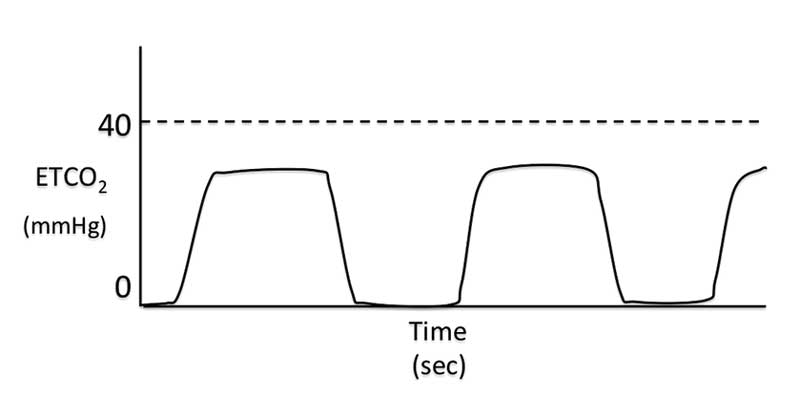
A normally shaped capnogram with a lower than normal plateau may be due to hyperventilation (Figure 7). If the patient is being manually or mechanically ventilated then the rate of ventilation/ventilator settings should be evaluated. Other causes for a lower than normal alveolar plateau include decreased CO2 production (hypothermia) or decreased delivery of CO2 to the lungs (low cardiac output).
Ideally, blood-gas analysis should be performed when faced with persistent low ETCO2 levels with no obvious cause. The existence of alveolar dead space (ventilated, but underperfused areas of the lung), which may occur secondary to pulmonary thromboembolism, creates a situation in which peak expired CO2 levels are substantially lower than PaCO2 measurements.
Underperfused alveoli will not have participated in gas exchange and so contain gas identical in composition to inspired case, which is normally CO2-free. During expiration, this gas mixes with the gas from perfused alveoli, thereby diluting the ETCO2 in the expired gas.
Equipment failure can also result in abnormally low alveolar plateaus – for example, leaks in the gas sampling line – leading to constant “sampling” of room air, resulting in dilution of the exhaled gas and a falsely low ETCO2 measurement.
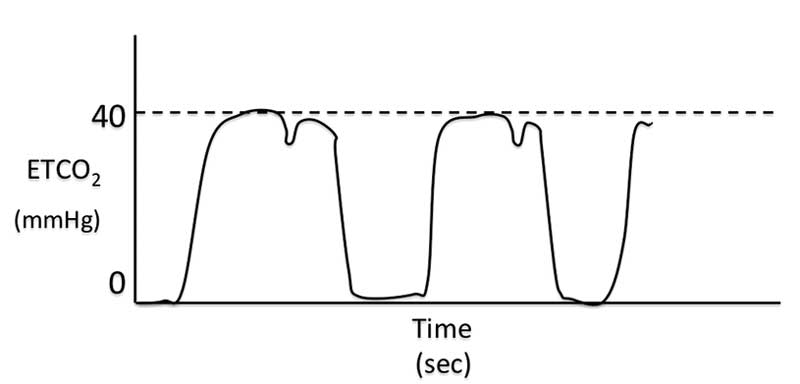
The normal alveolar plateau is roughly horizontal (Figure 3). Artifactual dips and bumps in the plateau may result from pressure on the thorax of an anaesthetised patient, resulting in gas moving in and out of the lungs. If a patient is being mechanically ventilated, spontaneous ventilator efforts may be interspersed among mechanical breaths, resulting in dips or clefts in the alveolar plateau. Causes of these respiratory efforts should be investigated and may include: insufficient anaesthetic depth, inadequate mechanical ventilation, hypoxaemia, inadequate analgesia and hyperthermia (Figure 8).
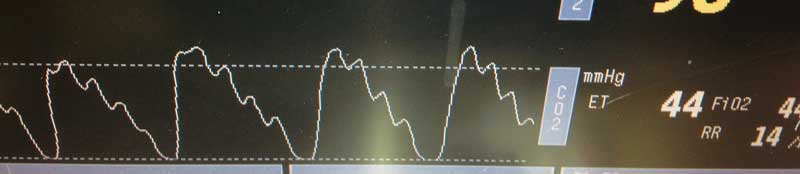
Cardiogenic or cardiac oscillations are undulations in the capnogram that are synchronous with cardiac contractions. Contraction of the right ventricle and filling of the pulmonary vasculature results in the expulsion of a small volume of air from the lungs with each beat. This is a common and inconsequential finding in anaesthetised patients (Figure 9).

Normally, the capnogram should return to baseline from the alveolar plateau, thereby creating a beta angle of about 90°. This occurs as fresh gas is inspired, thereby replacing CO2-containing gas at the sampling site.
If the slope of this phase is reduced (that is, increased beta angle) then either inspiration is not occurring normally or there is CO2 in the inspired gas. This could occur with inadequate fresh gas flow rates on non-rebreathing systems, or a malfunctioning inspiratory valve on a rebreathing system – for example, circle (Figure 10).
Capnography is a useful, non-invasive technique for the continuous assessment of ventilation and perfusion in patients. It is most commonly used in anaesthetised patients, but can also be a useful modality in conscious patients for non-invasive PCO2 monitoring.
It is not just the ETCO2 values that provide us with information – the waveforms can also give us a huge amount of information about a patient’s condition and provide an early warning sign to serious airway and perfusion issues.