27 Aug 2024
Neil A Forbes BVetMed, DipECZM(Avian), FRCVS, questions whether cleanliness could be better in practice, and how easy that might be to achieve.
Neil Forbes
Job Title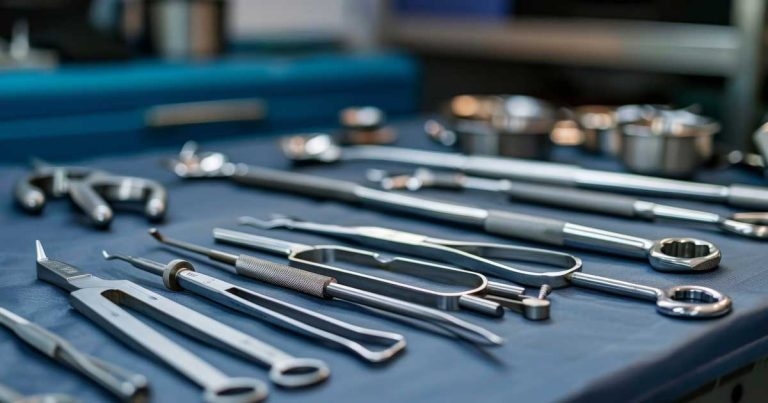
Image: G.Go / Adobe Stock
In these days of antimicrobial resistance (AMR), where only the “responsible peri-surgical antibiosis” is permitted, a greater focus has to be placed on hygiene, and the prevention of nosocomial infection, together with the control of zoonotic and pandemic risks, to staff, clients and veterinary patients.
Until now, the assessment of cleanliness has relied upon visual assessment, despite the fact that for many years it has been accepted that visual assessment alone is unreliable (Malik et al, 2003). Malik et al reported that “visual assessment yielded 90% pass”, “microbiology 10% pass”, “ATP [adenosine triphosphate] zero per cent pass”, putting the inadequacy of visual assessment into context.
Burgess and Morley (2015) have reminded us that “one cannot manage what one does not measure”, and the RCVS Practice Standards Scheme now requires participating practices to measure infection control outcomes. For many years, controversy and debate has existed between microbiology and ATP. While microbiology is specifically measuring the numbers of colony forming units (for a given measured area), in contrast, ATP bioluminescence measures organic residue levels, such as microbes, animal material, plant material and biofilms (however, not viruses).
Some workers state that it is the microbes’ presence on a surface that constitutes the risk of nosocomial infection (hence, microbiology is most applicable), while others suggest that, for “testing for the efficacy of sanitisation and assessing the potential for microbial proliferation”, ATP is more appropriate, as any residual “animal or plant material” indicates that the surface has not been adequately cleaned, the presence of microbes (bacteria and fungi) speaks for itself, while measuring biofilms is relevant to the risk of poor hygiene.
A biofilm is defined as “a community of microorganisms adhering to a surface and surrounded by a complex matrix of extra-polymeric substances” (Bridier et al, 2011). It is accepted that the biofilm growth mode induces microbial resistance to disinfection, which results in substantial economic and health concerns.
Bridier et al reported that 80% of microbes are found in the biofilm, and that microbes in a biofilm are 1,000× more resistant to the effects of disinfectants and antibiotics. Parvin et al (2019) have shown that more than 90% of dry surfaces in a human ICU are covered in biofilm; moreover, that even after 50 wiping motions with a cloth, only 96.7% of biofilms have been removed, showing how challenging it is to wipe away a biofilm from a dry surface.
Such biofilms on dry surfaces are shown to remain viable for in excess of 12 months. If a biofilm residue is left on a surface, it provides a nutritious medium for microbial growth and acts as a barrier to the direct action of both cleaners and disinfectants.
Conventional microbiological methods detect only microorganisms and can take 48 to 120 hours for results; in contrast, ATP measures organic material residue (including microbes), the cost per swab being perhaps one-twentieth of microbiology with results being available on site in 10 seconds.
ATP bioluminescence is not a standardised methodology: each relative light unit (RLU) reader has different benchmark values, not always clearly defined, such that a result with one manufacturer’s reader is not necessarily comparable with others; therefore, an advantage is available for operators working in a given field or discipline to use the same readers as each other, so that results are comparable.
ATP testing has been recognised by the US’ Centers for Disease Control and Prevention (CDC) as an objective way to appraise cleaning effectiveness in hospital settings and was recommended to CDC by its Hospital Epidemiology Committee (CDC, 2019).
Other research trials (Kim et al 2023; Singaravelu et al, 2023) used ATP effectively for the detection of recurrent reservoirs (typically fomites) of specific infections in human and veterinary hospitals, demonstrating an ability to detect, quantify and the origins of repeated contamination. ATP testing has been shown to improve cleanliness standards on health care surfaces where feedback from the testing is timely and continuous – particularly when regularly applied to potential fomite locations (Mitchell et al, 2020; Chan et al, 2015).
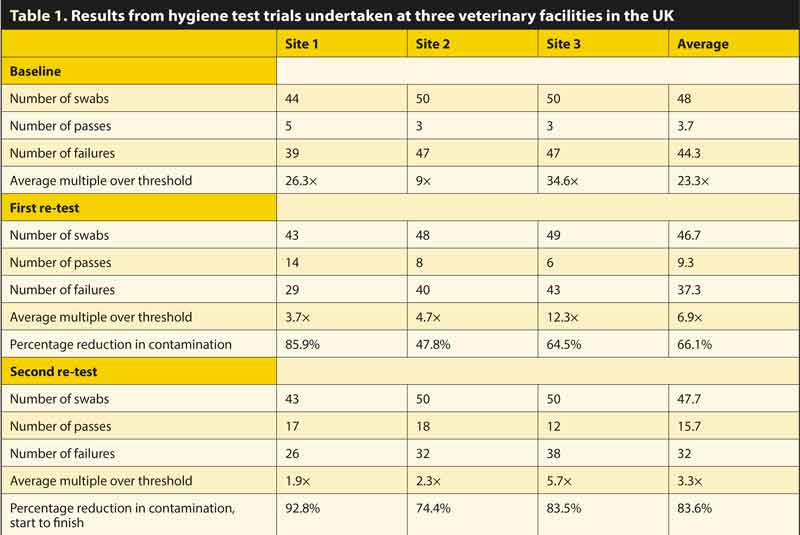
Prior to intervention, where both existing cleaning and disinfection products and procedures were in use, approximately 48 swabs were collected (unannounced, before the working day commenced) at three UK veterinary facilities, from common and standardised locations (using Hygiena Ensure ATP system), to quantify the level of contamination, as shown in the baseline results in Table 1.
Thereafter, a single (45-minute) staff hygiene control training session was given to as many staff of all roles as each practice could muster on their chosen day.
A standardised optimal cleaning system (using a proprietary biofilm remover at the start), followed by a proprietary disinfectant cleaner, prior to terminal disinfection, delivered by “fogging”, was introduced into all three sites. The standardised swab locations were retested (using identical methodology) in each facility, on average 70 days later. The veterinary facilities were all small animal, each owned by different corporate, first opinion practices, ranging in size from three to six vets.
A third test (in the knowledge of the results of the first post-intervention testing) was conducted on average 128 days from the start.
The standardised swab sites were divided into basic hygiene areas (floors, tables, work surfaces, kennels and patient kitchen areas) and frequent touch “fomites” (potential fomite) areas (door handles, keyboards, taps, phones, anaesthetic, laboratory analyser touch screens, staff kettles and x-ray controls). All swabs, at all sites, were collected by the author personally, to minimise any variability in site selection, collection or test methodology and, therefore, result.
Each swab was collected, activated and measured (within 30 seconds) in accordance with the manufacturer’s instructions. All swabs were collected and read by the author to minimise the risk of false variability. The outcome of each swab, was the quantifiable numerical result produced by the hand-held Hygiena Ensure Luminator ATP reader.
The cleaning at all sites involved the removal of biofilms, using a proprietary agent (F919, Health and Hygiene), with the provision of brush attachments for use on DIY hand drills to assist in the cleaning of challenging surfaces and areas.
Biofilm removal was repeated several times initially and thereafter prior to each deep clean (weekly or monthly depending upon usage). Cleaning was then undertaken with a safety-certified and efficacy-certified, recognised veterinary disinfectant cleaner (F10SCXD, Health and Hygiene), completed with a final, safety-certified and efficacy-certified recognised veterinary disinfectant (F10SC, Health and Hygiene), for use by fogging (while patients and staff are present).
All chemicals were applied in accordance with the manufacturer’s instructions.
This cleaning and sanitisation process was applied at each site, firstly because it is considered by the author to be an optimal process, but so as to standardise the cleaning procedure; therefore, removing a further variable. The cleaning protocol was explained verbally and in writing to the hygiene supervisor at each site.
Tests were only conducted on Tuesday (except where a Tuesday was the first working day after a bank holiday), Wednesday, Thursday or Friday mornings, avoiding mornings when an effective clean may not have been undertaken at the end of the previous day (weekends and bank holidays). On the morning of each test, the hygiene supervisor was asked if any untoward event had occurred in the preceding 24 hours which might be anticipated to give rise to abnormal test results; the author was not made aware of any such events.
In respect of fomite site collection, the swab sites were by definition pre-set; for example, x-ray switch, anaesthetic controls, light switches, keyboards and kennel doors. As such, it was considered that selection bias was not relevant.
Unannounced human hospital inspections with ATP testing exhibited failure in 72% of swabs (Malik et al, 2003), while more recent data (Chan et al, 2015) reported an initial (pre-intervention) failure rate of 57.1%; in contrast, in this trial, the average failure rate using existing products and current cleaning and disinfection protocols over the three sites was 92%.
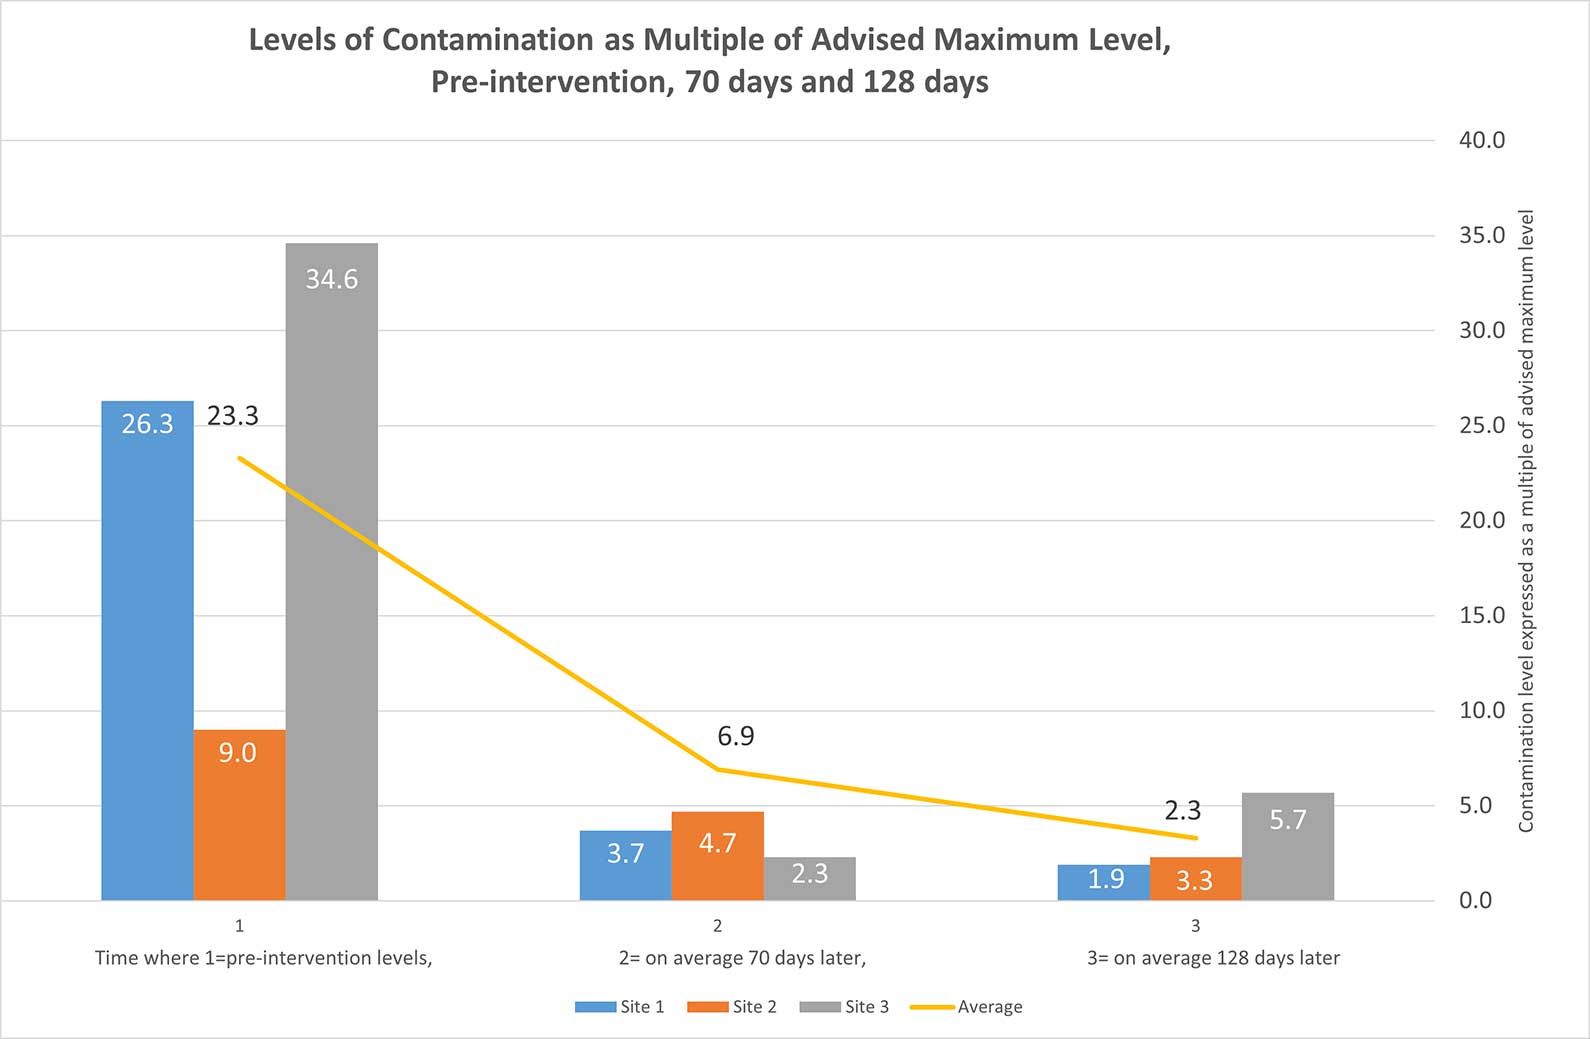
The level of contamination detected before intervention, such as using current in-use cleaning and disinfectant products and methods, was 23.3 times the recommended maximum level, with a 92% failure rate, as shown in the baseline results in Figure 1. The thresholds used were 100 (in public access and clerical areas), 50 in patient side areas, 25 in intensive care environments, and 10 in food preparation and sterile areas. These thresholds were selected based on research conducted with Hygiena Ensure in human hospitals.
Using two-stage sanitisation protocols with the propriety cleaning and disinfectant products, upon the first post-intervention sampling (on average 70 days later), the average failure multiple was reduced from 23.3 to 6.9 times – an average of 66.1% reduction in the quantum of contamination was recorded.
Following the sharing of results subsequent to the first post-intervention test, each practice had a further 60 days to improve its efforts prior to a further test. At the second post-intervention test, a reduction of contamination levels (start to final test) of 83.6% was achieved, with a reduction from 23.3 times to 3.3 times more than the maximum recommended level.
Based on this very small feasibility study, it appears that training with understanding, improved hygiene procedures and regular testing may be able to achieve a reduction in contamination levels of more than 83% within four months in UK veterinary practices. We can and should be doing practice infection control much better.
The author urges the RCVS to push for the Practice Standards Scheme to be made compulsory for all UK vet practices.
The author believes a larger controlled trial should be undertaken to provide statistically significant results, with subsequent publication in a peer-reviewed journal.
This publication would also detail the levels of contamination detected in different practice areas and on common fomites, as well as advising on numbers of swabs and required frequency of testing, in different sizes and types of practice.