10 Jul 2017
Celia Marr discusses novel ECG techniques, such as using smartphone technology, and best advice when examining horses.
Celia Marr
Job Title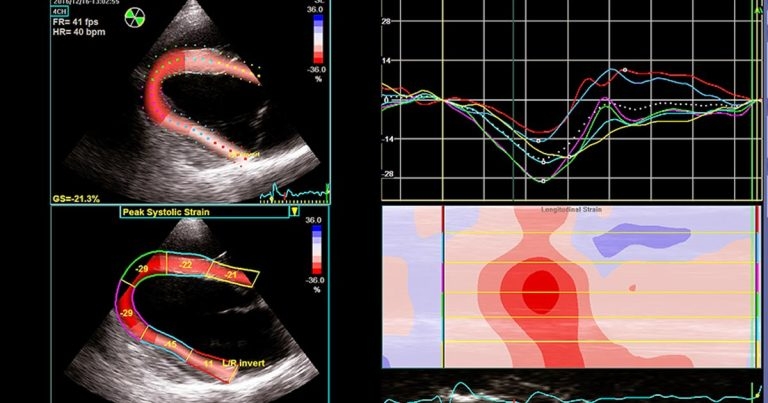
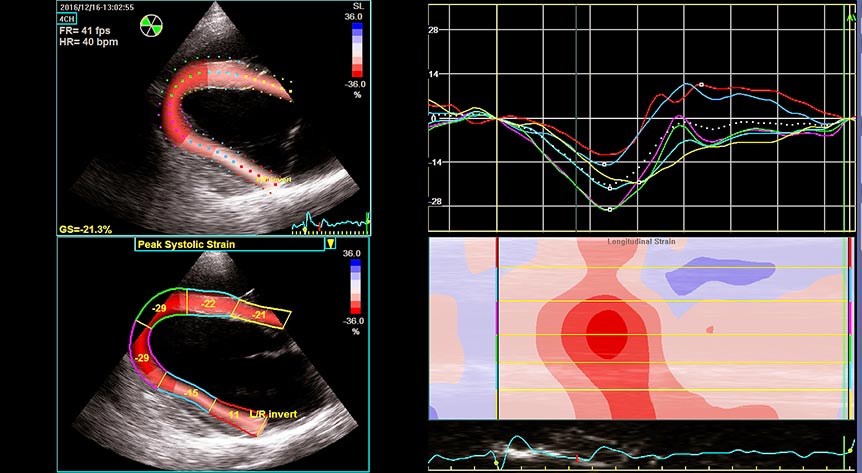
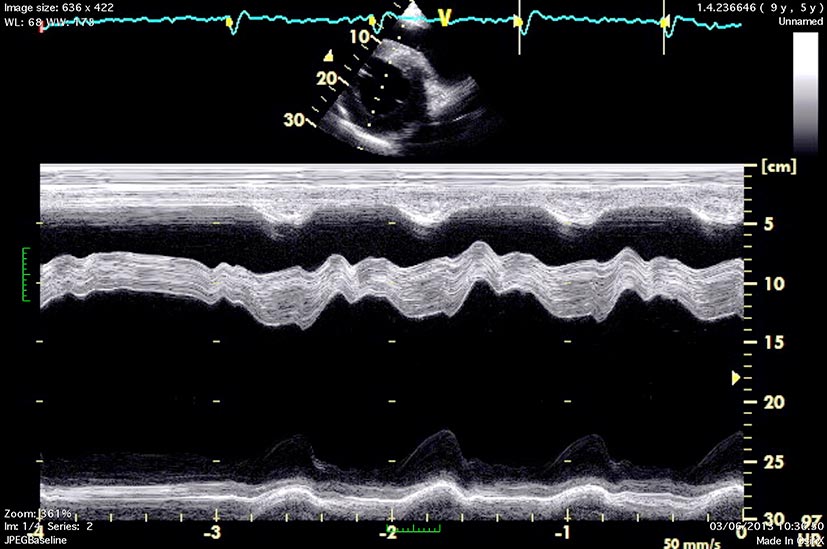
Figure 5. Speckle tracking echocardiography – in a longitudinal image of the left ventricle, offline analysis allows myocardial deformation (strain) to be documented in various regions. This is depicted as traces of longitudinal strain against time (upper right panel) and as colour-coded two-dimensional (left panels) and M-mode maps (lower right panel).
Equine cardiology is technology-driven. Advances include the introduction of smartphone ECGs, bringing them into the pockets of many clinicians.
Speckle tracking is the most promising of the various advances in equine echocardiography, but, as technology continues to improve, three-dimensional echocardiography is already showing potential in horses.
Cardiology in the horse is focused on diagnosis and prognosis – and, as such, advances in the field tend to be driven by technology. For the equine practitioner, diagnostic tools once out of reach – because the frequency they would be used did not justify the expenditure on equipment, or the investment of time to learn how to use them – are very much more accessible nowadays. In fact, the device you need is almost certainly in your pocket.
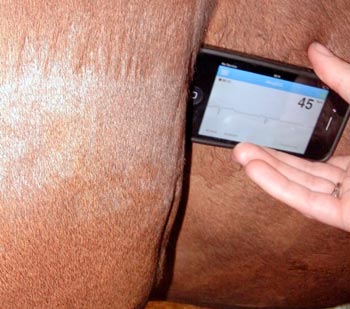
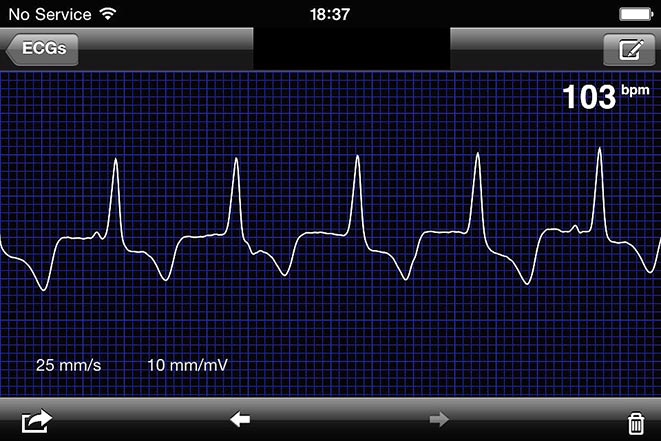
Smartphones can be converted to single-channel ECG recorders by attaching a clipless recording device. Together with an app with some very sophisticated algorithms, it is possible to record an ECG simply by placing the device against the horse’s left thorax, immediately behind the triceps muscle. Crocodile clips and leads that upset the horse are no longer needed. The ECG obtained is recorded on a single channel and, therefore, limited to simply establishing rhythm.
Nevertheless, useful diagnostic information can be achieved and one of the huge benefits lies in the fact equine ECGs can easily be recorded immediately after exercise (Figures 1 and 2; Panel 1).
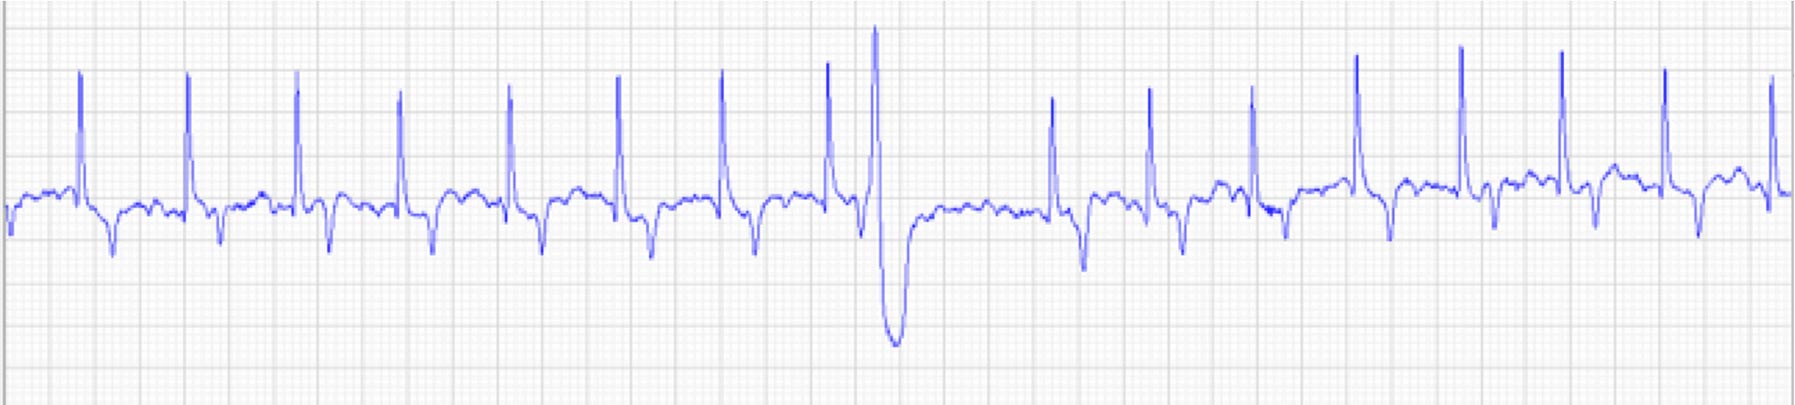
The transition phase immediately after fast work is a period of cardiac electrical instability; autonomic influences are slowing the heart rate with a background of high circulating catecholamine levels, and potentially hypoxia and high serum potassium concentrations. In 2010, Physick-Sheard and McGurrin1 reported 16% of apparently healthy Canadian standardbred horses exhibited complex ventricular rhythms after racing.
A subsequent study in Danish trotters, confirmed ventricular dysrhythmias were common following racing, while during racing 54% of horses had premature depolarisations2. In a much larger standardbred study – this time recording before and after, but not during, racing – several cases of post-race dysrhythmias were documented, albeit at a lower prevalence than seen in studies where horses raced wearing ECG recording devices3.
Reliable technology to record ECG during racing in Thoroughbreds is not yet available or approved for use. However, data collection for a post-race dysrhythmia survey on British racecourses has been completed and analysis of data is underway. It is likely the results in Thoroughbreds will be broadly similar to those in standardbreds.
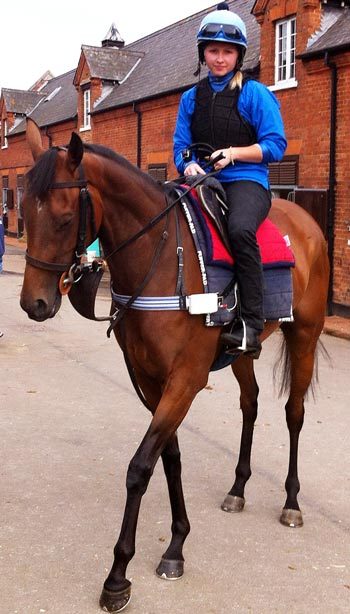
In the majority of cases, a small number of isolated premature depolarisations after exercise are likely to be of no clinical relevance. However, detection of frequent premature depolarisations or more complex rhythms warrants further investigation, with the aim of quantifying their frequency during and after exercise. It is also important to rule out the possibility that dysrhythmias may be present at rest. Ambulatory (Holter) recording devices are useful in this respect because they can be fitted under tack or while the horse is left unattended in a stable (Figure 3).
It is also useful to measure serum cardiac troponin I concentrations. Cardiac troponin is released with myocardial injury. In the majority of dysrhythmia cases, the cardiac troponin I concentration will be normal. However, considerable value is placed in identifying the occasional case with increased cardiac troponin, since this is likely to merit further investigation and a more cautious prognosis.
Similarly, it is fairly unusual to detect marked echocardiographic abnormalities in horses presenting with exercise-associated dysrhythmias. However, beware in those cases where the echo exam is abnormal since this may indicate important structural cardiac disease or more generalised cardiac dysfunction (Figures 4 and 5).
Two-dimensional, M-mode and Doppler echocardiography were established as important tools in equine cardiology in the 1980s and 1990s. Since then, a large amount of useful data has accumulated about the assessment of common conditions, such as aortic and mitral valvular disease in middle-aged and older horses4,5, and showing that physiological valvular regurgitation is common in Thoroughbreds and has little impact on their racing performance6.
However, it could be argued equine clinicians have been slow to embrace the novel echocardiographic technologies, such as tissue Doppler imaging (TDI) – in part because myocardial disease is uncommon in horses.
TDI allows regional myocardial events to be documented. Equine studies have concentrated on myocardial velocities and radial function7, 8. In common with other Doppler-based imaging, accurate assessment of velocity requires the ultrasound beam to be aligned parallel to the direction of flow or moving structure under interrogation. In humans and small animals, TDI measurements are obtained from apical views to assess longitudinal cardiac function. However, apical images cannot be accessed in horses and, therefore, clinical use of TDI in horses is limited to documentation of timing of cardiac events9,10 rather than being able to investigate longitudinal or circumferential function.
Two-dimensional speckle tracking allows quantification of ventricular wall motion, and evaluation of global and regional cardiac function. Each myocardial region has a unique pattern of speckles created by acoustic interfaces within the tissue. Identifying and tracking the movement of these speckle patterns identifies myocardial deformation. The relative deformation of a myocardial segment is described by strain and expressed as percentage change from its end-diastolic length. Depending on the image plane under assessment, speckle tracking can be used to evaluate longitudinal, circumferential and radial function. Critically, it is not angle-dependent, so it therefore offers much more potential than TDI in horses (Figure 6).
Most papers published on speckle tracking have been aimed at documenting optimal imaging techniques, establishing normal values, and reporting the reliability and repeatability of the technique11,12. However, reports have emerged showing its potential in evaluating clinical problems13.
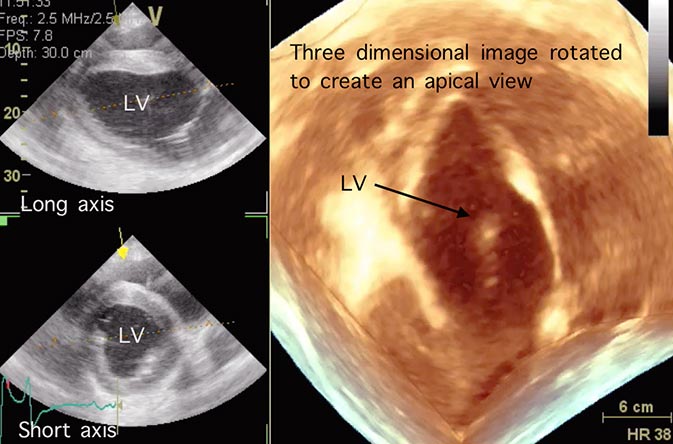
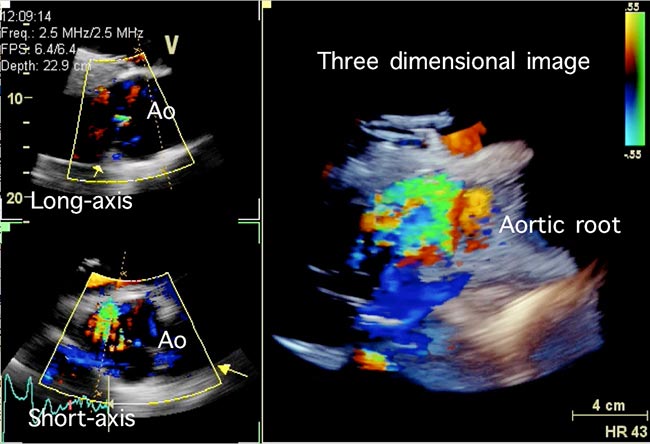
The most sophisticated form of echocardiography is three-dimensional imaging. In humans, three-dimensional approaches are recommended for assessment of volume and the functional measurements dependent on volume measurement, such as stroke volume and cardiac output. It seems likely this approach will be feasible in horses, although the reliability and repeatability remain to be determined.
The resolution of imaging of internal cardiac structures, such as valves that can be achieved with three-dimensional echocardiography, is less than that available with conventional two-dimensional echocardiography. The overall size of the horse and its heart poses challenges, but its low heart rate does mean lower frame rates can be used, which can compensate to some extent. Nevertheless, it is likely three-dimensional echocardiographic technology will continue to improve and, as it does so, its place within the diagnostic tool kit for equine cardiology may continue to develop.
Turning to therapy, technology has also developed in this area of equine cardiology. Electrocardioversion is a reliable option for treatment of atrial fibrillation14-16. It relies on the insertion of electrodes in the left pulmonary artery and the right atrium, across which a series of biphasic shocks can be delivered to suppress aberrant electrical activity in the atria and restore sinus rhythm.
The original reports of the technique are more than a decade old. However, it is only recently a reliable commercial source of the catheters/electrodes required to deliver transvenous electrocardioversion (TVEC) has been established.
TVEC has emerged as first-choice therapy when the duration of atrial fibrillation is unknown or longer than four to six weeks. TVEC has not entirely replaced quinidine sulphate and, indeed, the success rates with quinidine are similar to those of TVEC17,18. However, quinidine has long been recognised to have adverse effects. Since the advent of a viable alternative, clinicians should be cautious about giving numerous doses of quinidine because the risk of side effects begin to escalate when numerous doses are given. Nevertheless, quinidine remains a very reasonable approach – particularly in horses known to have had atrial fibrillation for a short period of time.
Panel 1. Tips for using clipless smartphone devices in horses.
Recording an ECG
Interpreting an ECG