26 Mar 2024
With mean lameness prevalence in UK and worldwide herds around a third, and the livestock sector facing increasing cost pressures, tackling it remains an important focus. This article, the first in a two-parter, looks at research for a key condition.
Jessica Reynolds
Job Title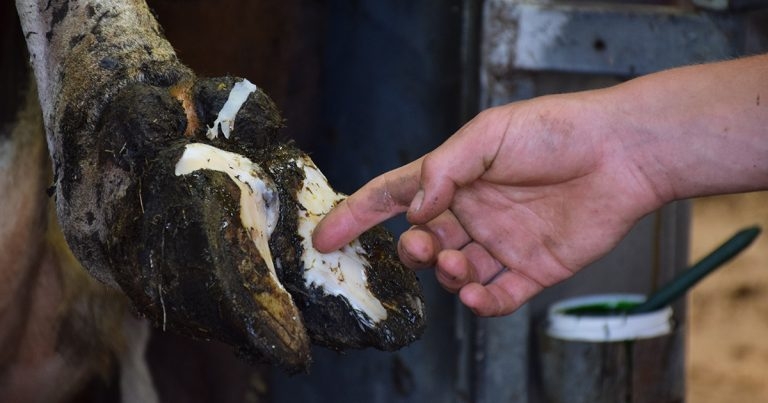
Image @ Irisalsoog / Adobe Stock
Lameness is an endemic issue in the UK dairy industry, with severe financial and welfare implications and significant impacts on industry public perception (von Keyserlingk and Weary, 2017).
UK mean lameness prevalence is estimated to be 31.6% (Griffiths et al, 2018), with similar worldwide approximations (Solano et al, 2015). Historical economic cost of white line disease has been estimated at £300 and sole ulceration at £519 per case, including direct (treatment, labour and increased waste milk) and indirect (reduced milk yield and fertility, plus increased culling risk) costs (Willshire and Bell, 2009). Accounting for inflation since this research, current financial cost is estimated to be 1.3 times higher than documented (Newsome et al, 2019).
As the industry rightly becomes under increasing pressure to reduce lameness prevalence, both for welfare and socioeconomic reasons, the role of the farm vet is ever-more important in coordinating a multi-disciplinary effort to manage lameness on farm. This article is part of a two-part series aiming to present the reader with an evidence-based approach for investigating lameness in the dairy herd, with particular focus on developing research pertaining to claw-horn lesion (CHL) aetiology, management and prevention.
Aetiopathogenesis of white line lesions and solar lesions are hypothesised to have similar origins (Lischer et al, 2002). Application of excessive ground-reaction force to solar germinal epithelium disrupts the dermal layer and prevents appropriate growth and keratinisation of hoof horn, resulting in solar and white line haemorrhage (Hoblet and Weiss, 2001).
In later stages of disease, this leads to solar ulceration or undersole separation due to impaired horn production (Tadich et al, 2010) or impaction and separation of the white line (Winkler and Margerison, 2012), increasing risk of foreign body entrance (Leach et al, 1997). Mobilisation of fat (commonly postpartum) from the digital cushion further reduces shock absorbance capacity (Newsome et al, 2017a; 2017b), which – alongside weakening hoof suspensory apparatus surrounding parturition (Tarlton et al, 2002) – increases risk of epithelial trauma. The ensuing inflammation generates a periosteal reaction within the distal phalanx, resulting in exostoses formation, increasing scarring of the digital cushion. This reduces shock dissipation and increases pressure on the germinal epithelium, further perpetuating the cycle of epithelial damage and further CHL (Newsome et al, 2017a; 2017b).
Extrinsic environmental factors, such as abrasive flooring surface, decreased lying time, increased competition for resources and social competition, increase risk of foot exposure to abnormal force loads, which, combined with intrinsic physiological events, negatively impacts force dissipation within the foot and increases risk of CHL development (Bicalho and Oikonomou, 2013).
A real herd example now follows to demonstrate how the combination of herd and individual cow level data analysis and consequent evidence-based recommendations can form the basis of the successful investigation of a lameness problem in the dairy herd.
Prior to history taking and starting consultation, using appropriate communication techniques is vital in establishing an effective working relationship and a farmer’s own reasons for tackling a lameness problem, if any. Unfortunately, large differences are reported between farmer-observed and trained mobility scorer records of lameness (Leach et al, 2010), with motivation for starting control programmes sometimes originating from the practitioner and reducing success of any proposed control measures before they have even started.
Use of motivational interviewing, rather than a directive style of communication, is evidence-based and can help foster two-way conversations, enabling farmers to discuss their perception of problems on farm and potential solutions, improving success of farmer-vet collaboration (Bard et al, 2017).
The example herd requested an investigation through its first opinion veterinary surgeon, reporting an increasing prevalence of lameness with a number of chronic cases.
Initial details of the farm were:
Assessment of farm environment, foot trimming, cow factors and collection of mobility score and foot trimming data form the basis of investigating a lameness problem on farm.
In terms of data analysis, commonly used key performance indicators for mobility score and lameness treatment data are shown in Table 1.
| Table 1. Lameness key performance indicators (Huxley et al, 2012) | ||
|---|---|---|
| Lameness key performance indicator | Description | Target |
| Newly lame cows (identified by mobility score, calculated from two consecutive fortnightly or monthly recordings) | Number of cows moving into score 2 or 3 as a percentage of those at a score 0 or 1 at previous recording | Below 1% to 5% |
| Chronically lame cows (identified and calculated as above) | Number of cows consistently recorded as a score 2 or 3, in consecutive recordings as a percentage of all those at a score 2 or 3 at previous scoring | Below 25% |
| Recovered lame cows (identified and calculated as above) | Number of cows recorded as a score 0 or 1 as a percentage of all those at a score 2 or 3 at previous scoring | More than 75% |
| Lameness index (identified by mobility score) | Percentage lame (score 2 and 3) | Below 10% to 15% |
| Percentage severely lame (score 3) | Below 1% to 2% | |
| Incidence rate of lameness cases (identified by cases treated for lameness) | Number of cows treated for lameness/100 cows at risk/year | Below 10% to 20% |
| Frequency of mobility scoring | Every 2 weeks | |
| Time between identification and treatment of lame cows | Lame (score 2) | Maximum 48h |
| Severely lame (score 3) | Maximum 24h | |
Caution should be exercised when using solely treatment data to benchmark or draw conclusions about herd lameness, as a high treatment incidence may represent increased prevalence of lameness or quick and accurate detection of cases.
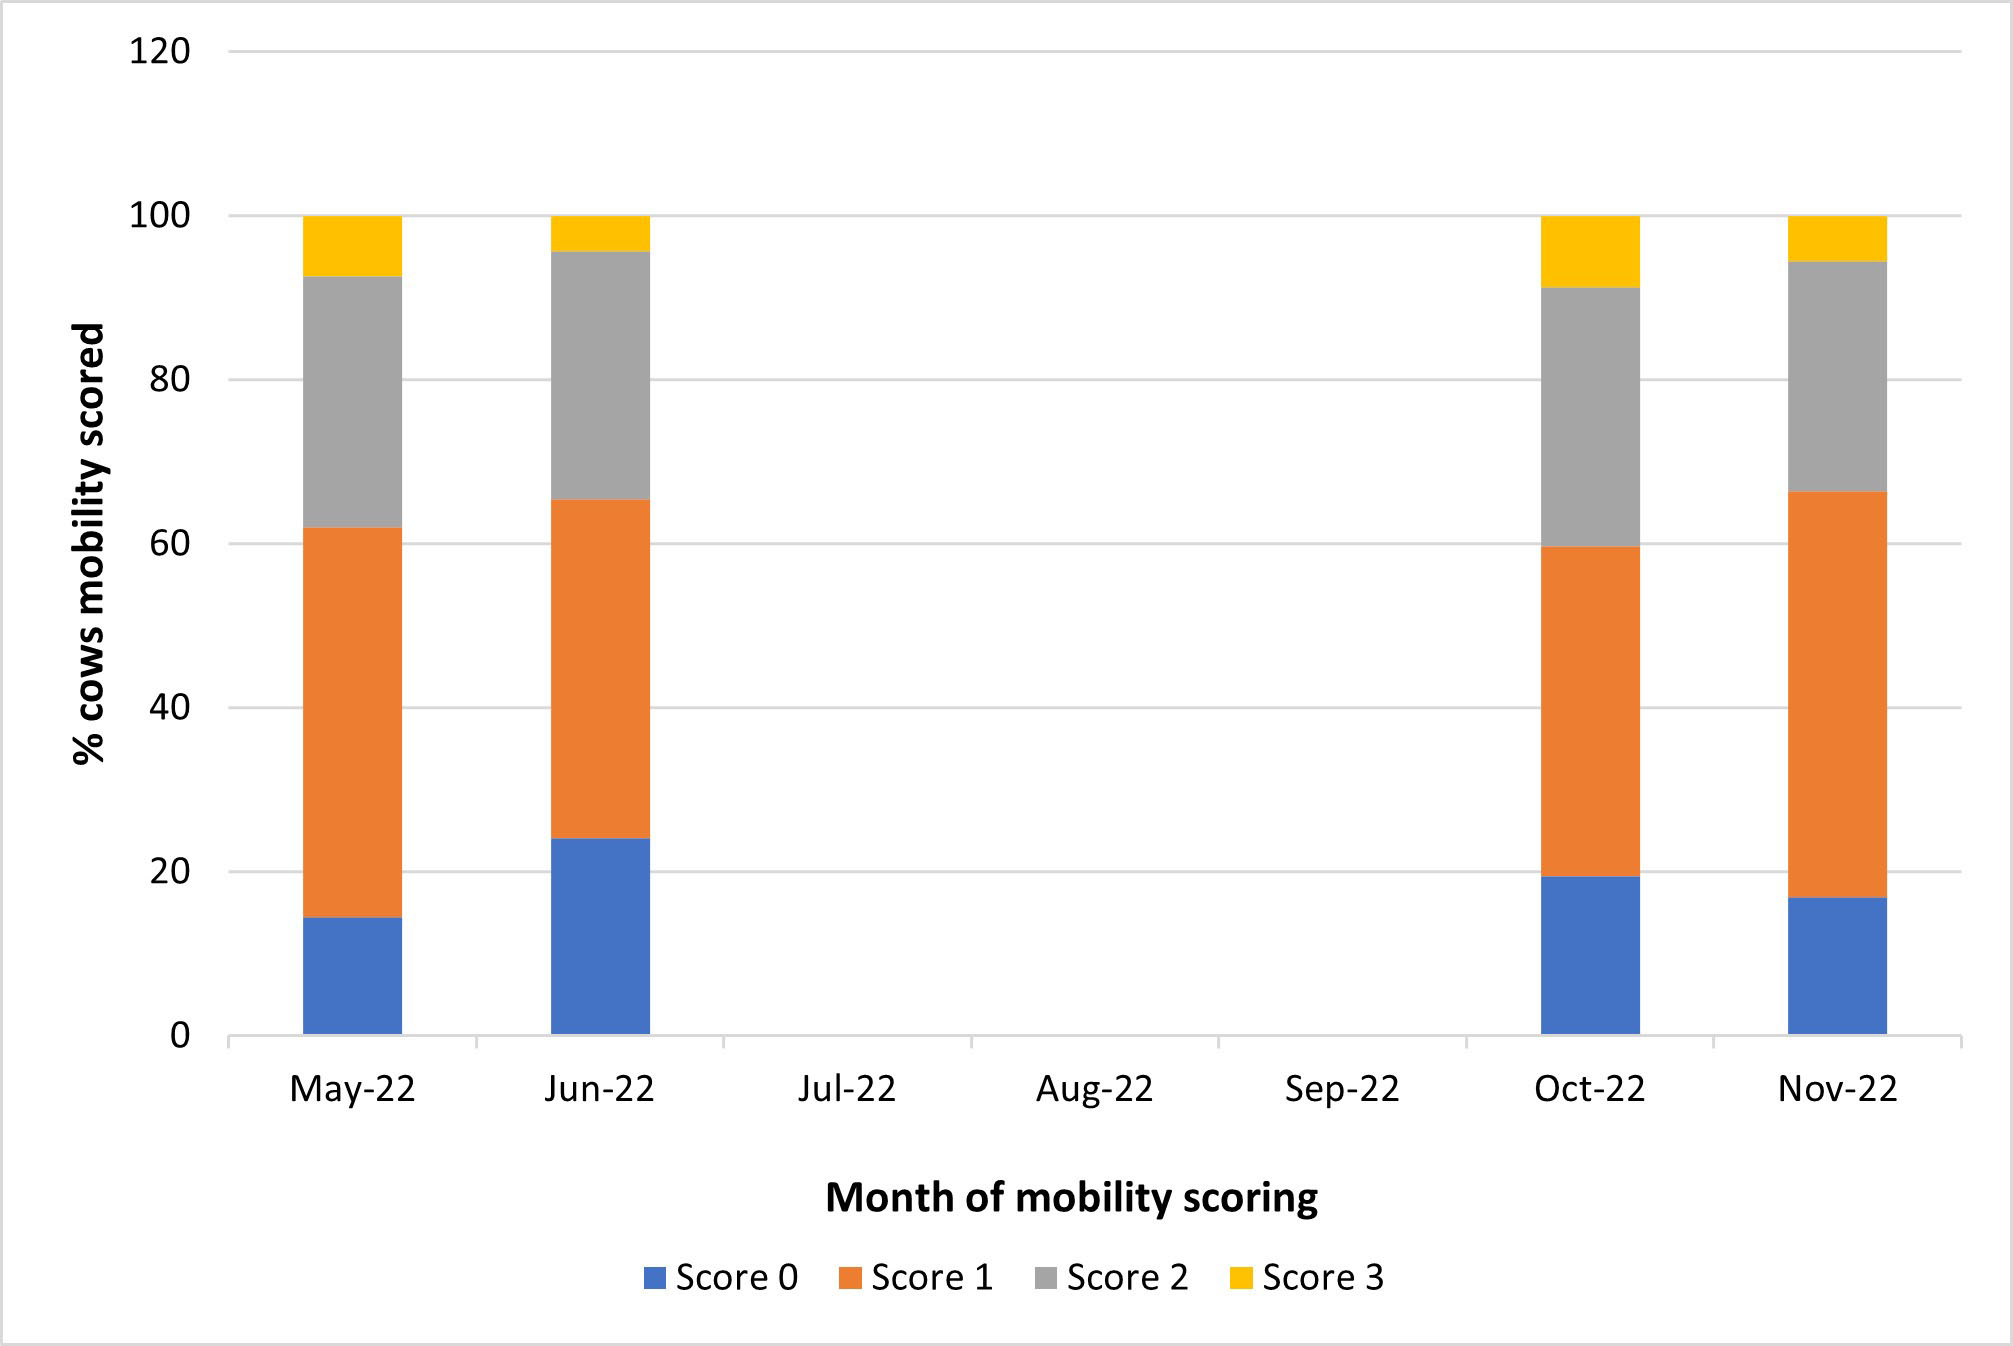
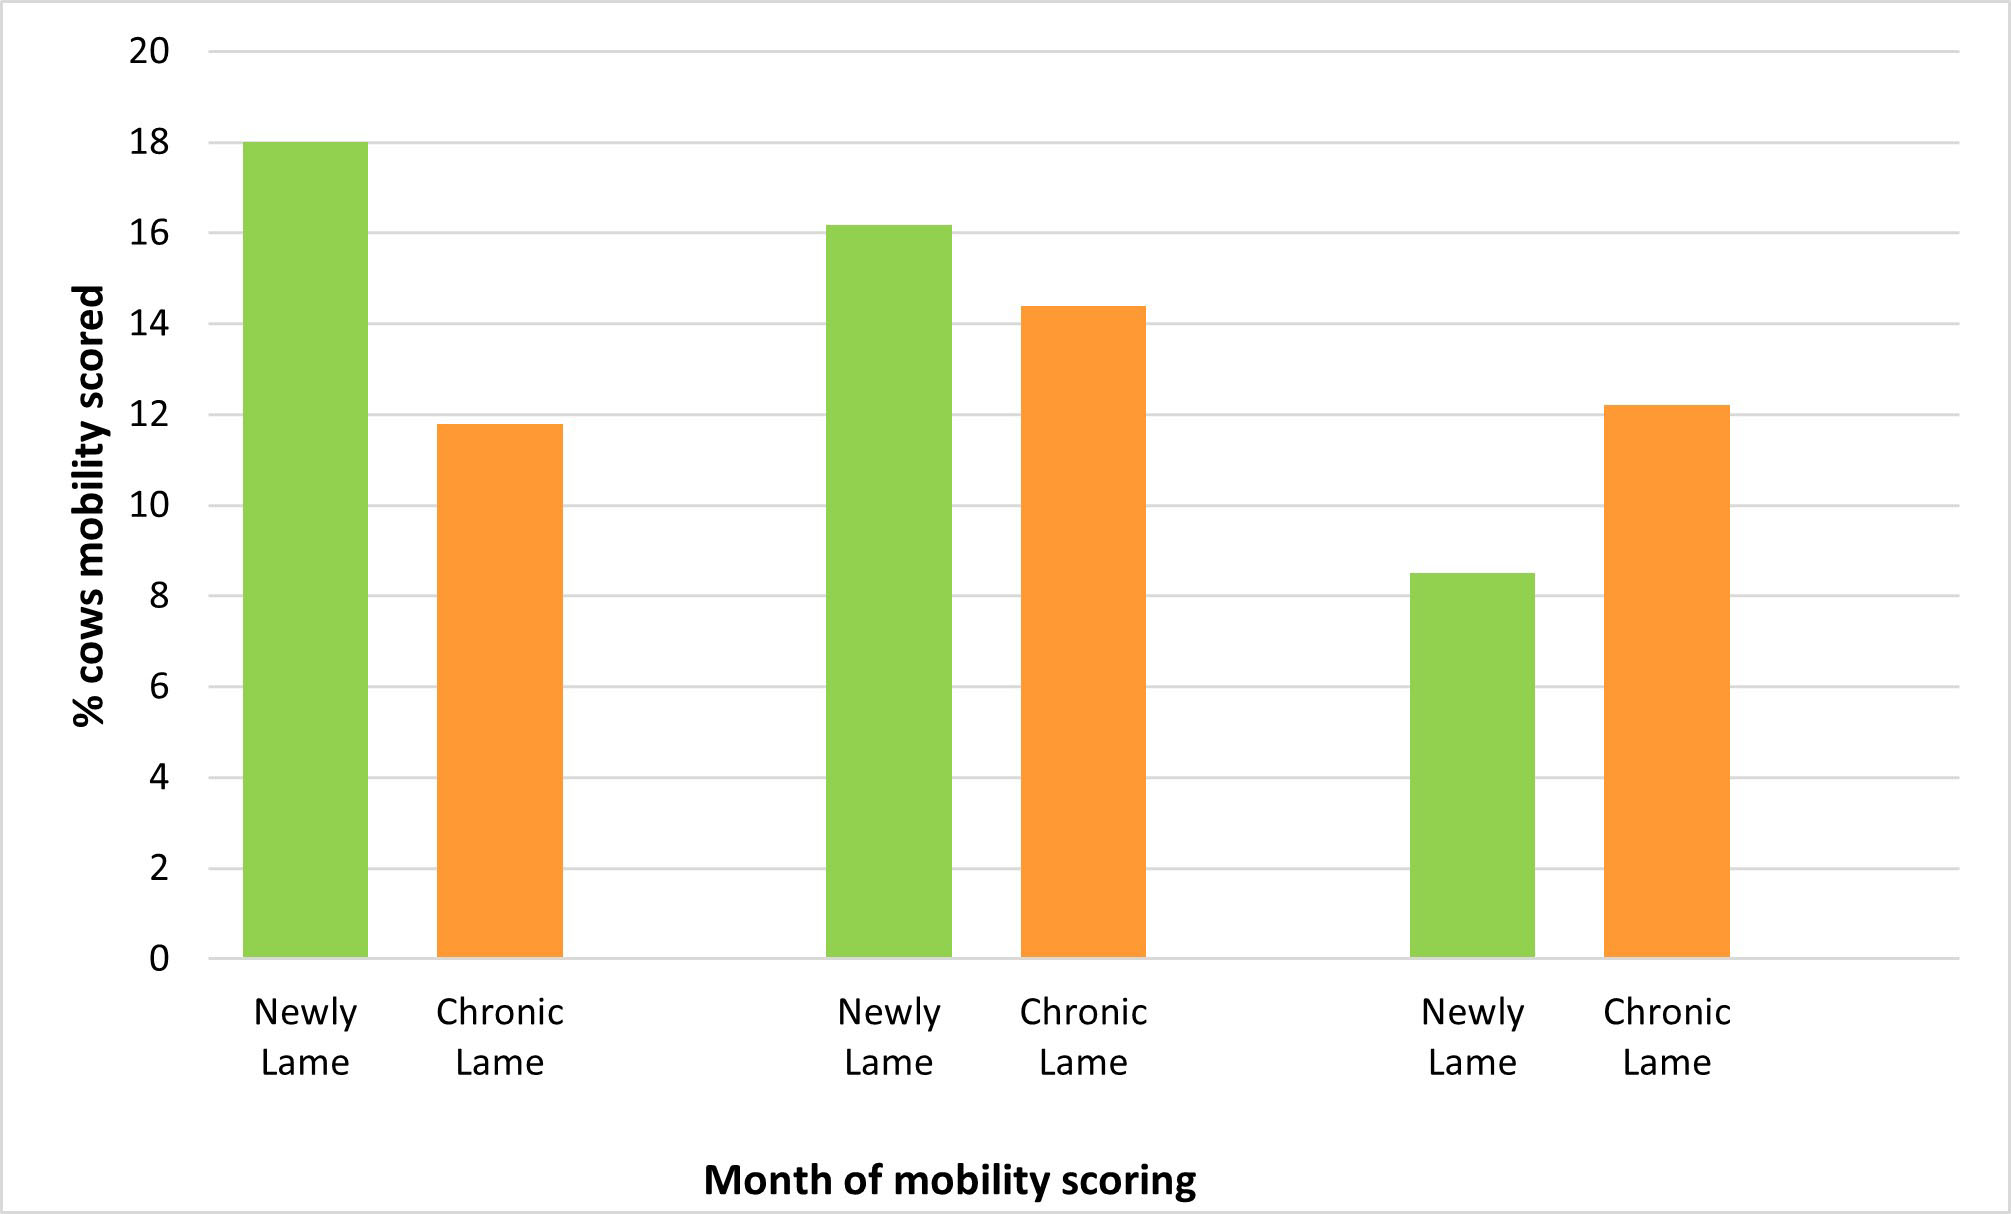
Initially assessing mobility score data to benchmark lameness prevalence over time and proportion of newly and chronically affected cows by month can help direct further data analysis. Available data for this example herd is shown in Figure 1. Lameness prevalence (score 2 and 3 cows) was consistently between 35% and 40% (Figure 1a), with proportion of new and chronically lame cattle identified from mobility score data shown in Figure 1b.
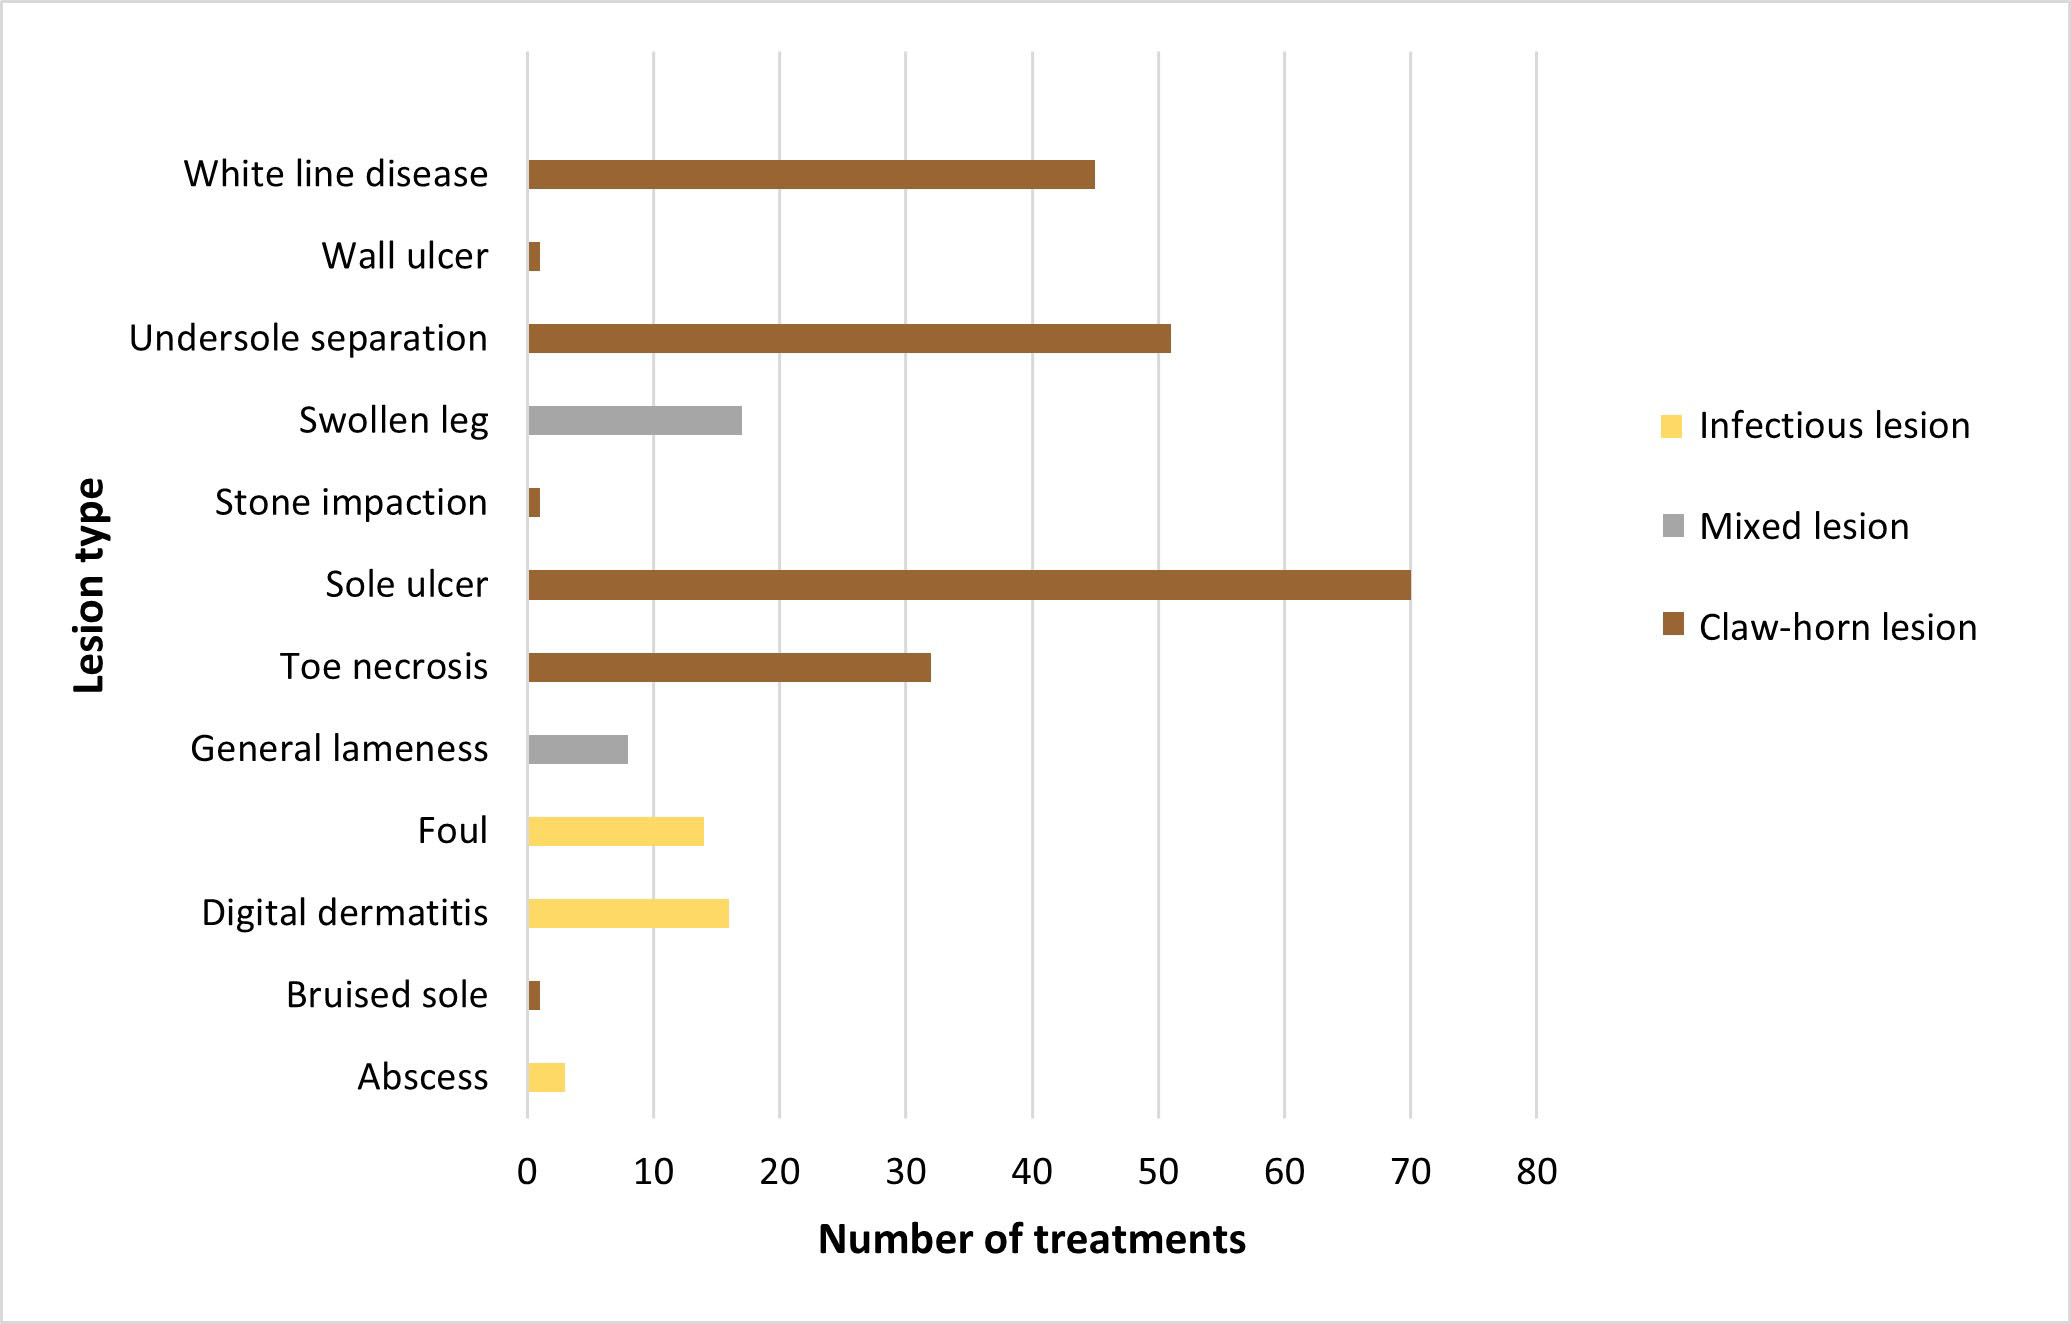
Assessing lameness treatment data from foot trimmer visits or farmer treatment must also be analysed to assess common lesions and identify any patterns noted over time or in different animal groups (days in milk [DIM] or parity, for example). In this herd, CHLs were the most prevalent lesion type identified (Figure 2a), at 77% of all 259 lesions reported. Infectious lesions and general lameness or swollen legs represented the remainder of lesions.
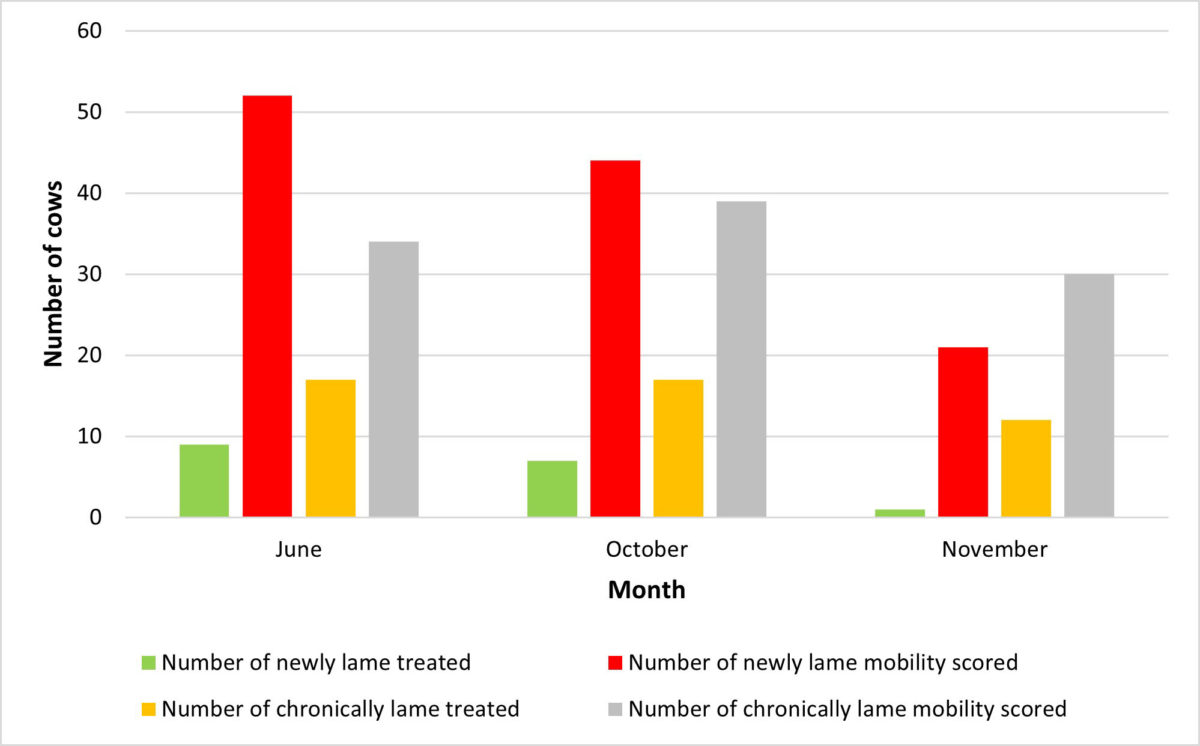
Treatment data and mobility score data were then combined to detect the predominant lesion affecting cows identified as newly and chronically lame by mobility score (Figure 2b). Only 17.6% (9 cows), 18.2% (8 cows) and 4.76% (1 cow) of newly lame cows in months with relevant scoring received a treatment. CHLs were the most prevalent lesion associated with new and chronic lameness; few newly lame cows (17 cows) were treated, so it is difficult to establish causality; however, toe necrosis and sole ulcer represented the most common lesion detected in chronically lame cows.
Distribution of CHL recorded (201 lesions) was analysed by DIM, parity, month of treatment, number of treatments per cow and foot treated for white line disease only. A quarter of cases required more than one treatment, with all toe necrosis cases reported representing repeated treatment of just six cows.
Frequency of CHL recorded increased in October and November, which was suspected to be due to an increased rate of CHL development in housed cows crowding around a fan in an August heatwave and increased treatment sessions in response to mobility scores.
Following assessment of data, visiting the farm to contextualise findings and assess farm environment and housing, relevant cow factors and foot trimming technique is strongly advised. This herd was visited during a trimming session, when cows were housed, and the following observations were made:
1. Trimming session
2. Environmental assessment
3. Cow assessment
Data and farm assessment for this herd showed that increased prevalence of lameness was found to be most commonly due to sole ulcer and sole haemorrhage CHL, with decreased frequency of detection and delayed inadequate treatment of new cases. Housing assessment revealed no additional cubicles for cow numbers and poor cubicle design, increasing risk of prolonged standing time and contributing to CHL development.
Recommendations based on early detection of lameness and prompt, effective treatment to maximise chance of recovery combined with environmental management to reduce external pressure on the feet, and incidence of new CHL, are covered in the second part of this series.