3 Dec 2024
Owen Atkinson explains why spreadsheets are essential to improving the health and well-being of cows.
Owen Atkinson
Job Title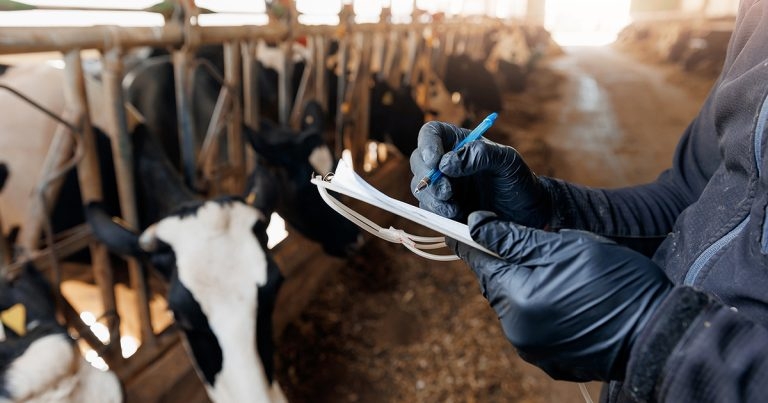
Image © Parilov / Adobe Stock.
Life as a farm vet is unpredictable at the best of times. One minute you’re just about to tuck in to your pie and chips, and the next, you’re armpit-deep inside a cow because she decided now was the best time to throw a uterine torsion. But amid the chaos, there’s a growing order – data.
Love or loathe it, data and spreadsheets are now as essential to dairy farming, and being a farm vet, as boots and rectal gloves. Whether it’s checking somatic cell counts, calculating milk from forage, or tracking antibiotic use, farms today rely on data to improve their operations – especially when it comes to the health and welfare of their cows, and as vets, we’re right in the middle of this data-driven revolution.
In this article, we’ll explore how key performance indicators (KPIs) are used to monitor herd health, how it ties in with the Animal Health and Welfare Pathway in England, and whether all these figures are actually making a difference.
Perhaps in times gone past, farmers might simply look at their cows, squint a bit, and know something wasn’t right. and to be fair, good stockpersonship still relies on reading the animals.
However, today’s modern dairies are also increasingly relying on technology to take the guesswork out of cow health and performance. Farmers now use everything from smart collars to milk sensors to gather data on their cows. It’s no longer about just fixing the cow in front of you – it’s about preventing problems before they happen.
Before we take a tour of some specific KPIs, let’s talk about how using data fits into the Animal Health and Welfare Pathway in England, the Animal Health Improvement Cycles in Wales, and the Animal Health and Welfare Interventions in Scotland. These are all part of the UK’s grand plan for farming post-Brexit, aiming to improve animal health and welfare across the board1.
As single farm payment subsidies are phased out, they are designed to offer financial incentives for farmers who are proactive about their herd’s health. The idea is that there should be direct reward for improving cow welfare and reducing disease incidence.
The schemes all essentially give farmers a nudge (and sometimes a financial carrot) to collect and use data – and that is where KPIs come in.
KPIs allow us to measure the things that matter, such as lameness, fertility, milk quality and antibiotic usage. They are like report cards for a herd, showing where improvements have been made and where a farmer is in the “could do better” column.
As vets, our role is increasingly about helping farmers interpret these KPIs and using them to guide treatment and management decisions.
The industry collaboration known as Ruminant Health and Welfare has outlined a welfare strategy for UK dairy cows, which has full support from the CVOs from all four devolved nations2. This has six strategic goals to support a vision of improving welfare, underpinned by centralised data collection to demonstrate progress and prove attainment of standards.
The six goals are to have:
The overall notion is that by tackling key welfare issues, and ensuring dairy producers have the business resilience to keep delivering high standards, this will help ensure a world-class reputation for the UK dairy industry to compete with other nations.
A plethora of potential KPIs can be used in dairy farming. Here, we will look at a selection that might fit with the six aforementioned strategic welfare goals.
It is worth bearing in mind at this point that we have a very diverse dairy sector in the UK – meaning that on the one hand we have low-input spring block calving herds (also known as the New Zealand system) and on the other hand we have high-input, all-year-round (AYR) calving and all-year housed, high-yielding Holstein herds (also known as the North American system), and then everything in between.
This means that the KPIs that are good for one herd might not be suitable for another. The Agriculture and Horticulture Development Board (AHDB) has done a great job of summarising some performance KPIs suitable for AYR herds and block calving herds3.
Let’s start with a favourite of mine: lameness. Lameness isn’t just a welfare issue – it’s a productivity killer. Every cow with impaired mobility is a cow that’s likely producing less milk and, worst of all, is in pain.
The true prevalence of lame cows is often far higher than anyone would like to admit. It is best measured using the four-point AHDB mobility score system4, which very briefly is:
For lameness prevalence, score 2 and 3 are classed as “lame”, while 0 and 1 are “non-lame”. One of the reasons why the true lameness prevalence is underestimated is that, without specifically looking for them, the score 2 cows can easily go unnoticed. We aren’t just talking about the ones obviously hobbling around the yard, which will be score 3.
Technology – as with mobility scoring apps, cameras, and wearables – helps in the tracking and management of lameness. Providing Register of Mobility Scorers-accredited mobility scoring12 for your clients is a great service to offer, and every serious dairy practice should have at least one trained mobility mentor to be able to deliver the Healthy Feet Programme.
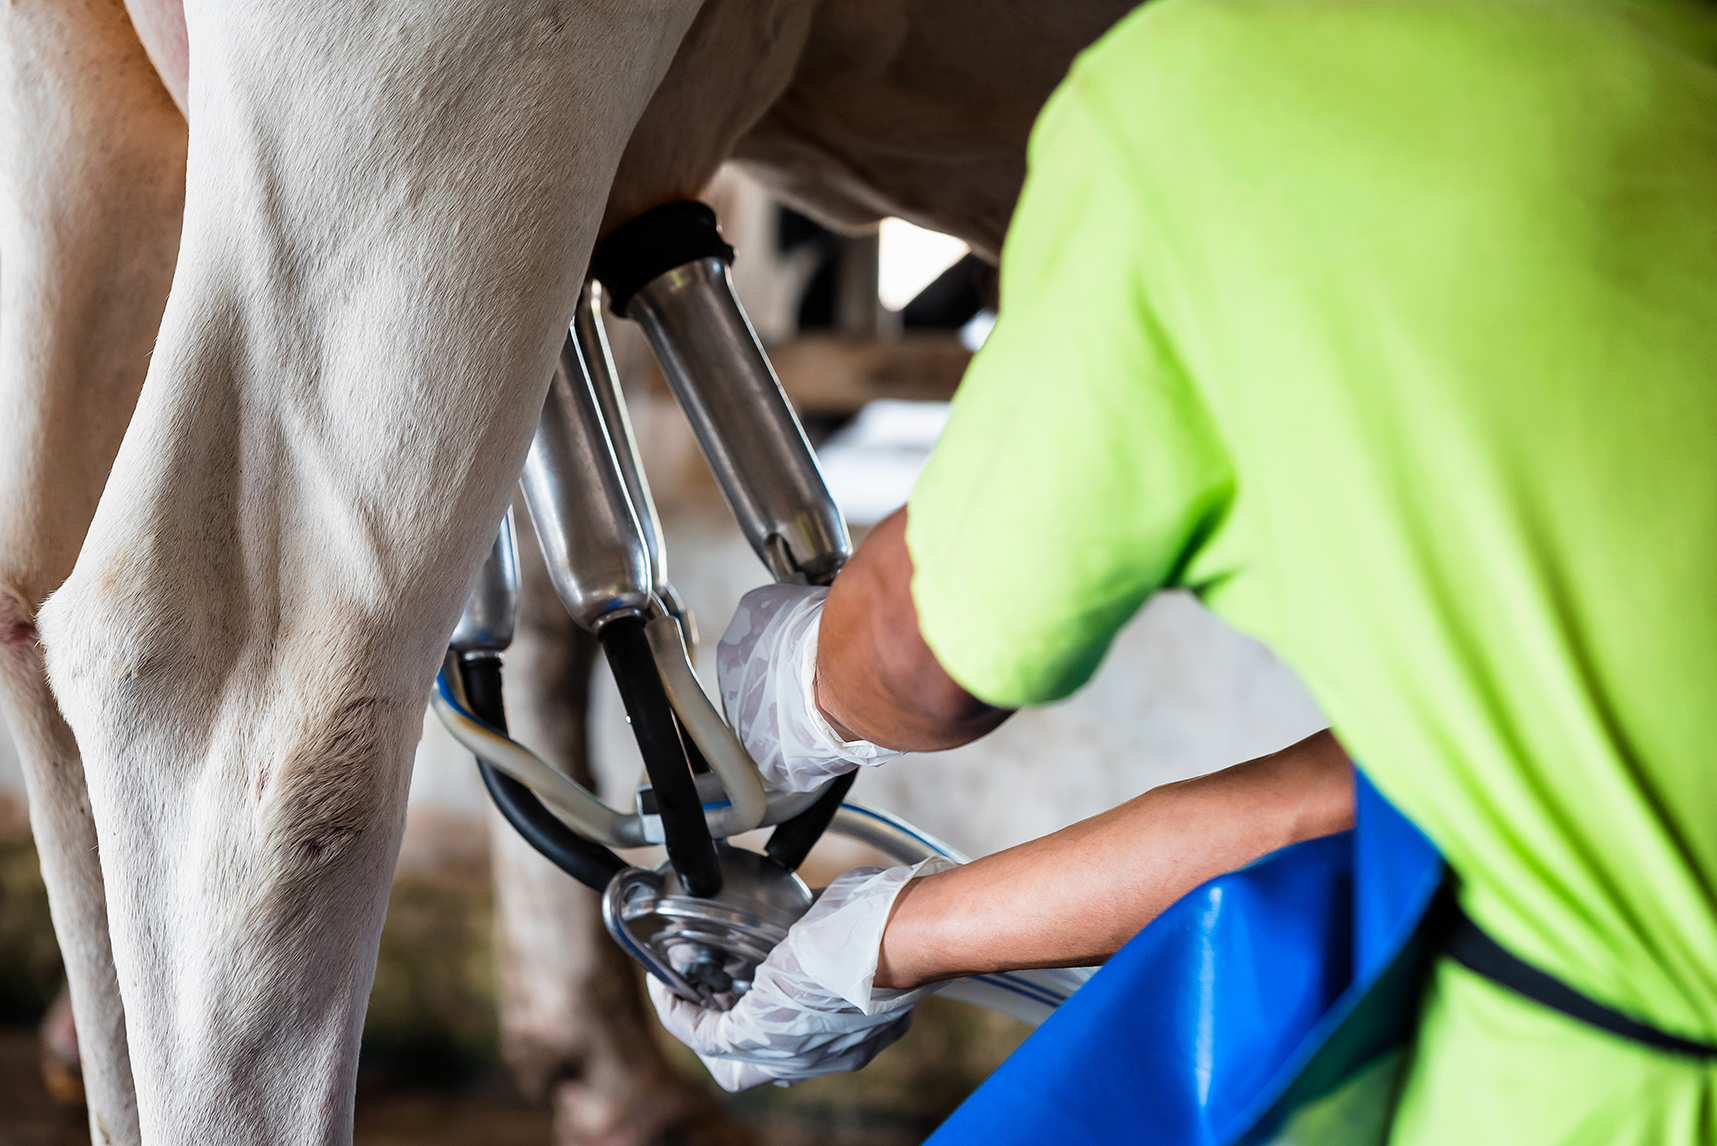
When it comes to udder health, herd somatic cell count (SCC) is the go-to measure. A consistently low SCC means mastitis-free cows, while a high SCC is a flashing neon sign that reads “our udders are in trouble”.
For us vets, SCC data is often a dream to work with. Most herds measure individual cell counts (and if not, why not?). The data are easily accessible through milk recording organisations, and we can track new infection rates, dry period cure rates and, with decent records of clinical mastitis cases, perform a pattern analysis to diagnose where the chinks in a herd’s udder health protection might be14.
The mastitis goal is fewer cases, which means less dumping of milk and fewer antibiotic treatments. However, the devil is in the detail: does a herd have a low recorded case number because they have poor detection? Are they recording cases that don’t receive antibiotics?
Analysing clinical case records must be done alongside looking at intramammary tube usage and herd cell counts:
Reducing mastitis is about prevention – good hygiene, selective dry cow therapy, a properly functioning milking machine, a good milking routine and avoiding contagious spread.
Collecting data helps farms track the effectiveness of their prevention strategies, but also whether their treatment protocols are correct.
For block calvers, a key success is having the heifers calve towards the beginning of the block. Therefore, an average age at first calving (AFC) of 24 months (or lower) is non-negotiable. AYR herds also benefit from a low AFC, for two distinct and very different reasons:
To calve successfully at two years old, the work begins at day one, when the heifer is first born. Any upset in growth rates due to inadequate nutrition or disease (calf scour or pneumonia) will result in either not achieving the goal, or calving a heifer that simply is not big enough.
Useful youngstock services offered by dairy veterinary practices include regular weighing, benchmarking, routine testing of calves for colostrum antibody absorption, worming advice and heifer synchronisation.
Every herd will be interested in its conception rate – the percentage of cows that become pregnant after insemination. If a farm’s conception rate is low, cows are either not being inseminated at the right time or something is off with fertility.
Of course, conception rates are only one half of the fertility story – heat detection being the other half. Block calving herds tend to combine the two to give a six-week or nine-week in-calf rate, whereas AYR calving herds use “pregnancy rate” to indicate the proportion of eligible cows that become pregnant every 21-day cycle.
Farms using data to track heat detection, insemination timing and nutrition are the ones getting higher conception rates. Sloppy semen handling easily catches some farms out, so encourage pedantry here. Technology to improve heat detection, such as activity meters, can also improve timing of insemination, which improves conception rates, too. It’s almost always a very sound investment.
In the age of antimicrobial resistance, antibiotic use is a crucial KPI for herd health. Central to the Animal Health and Welfare Pathway is a big push to reduce antibiotic usage on dairy farms. Overuse not only drives resistance, but also comes with financial and public health costs:
By using KPIs to track where antibiotics are being used (and how and why), farms are finding they can cut back by improving management of endemic production disorders, such as mastitis; infectious disease control, such as bovine viral diarrhoea and infectious bovine rhinotracheitis; and vaccination programmes. Profligate use of antibiotics is usually indicative of unsuitable treatment protocols, as well as not getting the basics right.
The initiative MilkSure helps vets regularly review exactly what medicines are being used, and in what way17. Many herds have found they can reduce antibiotics simply by acting smarter and sticking to the directions in the marketing authorisation.
Historically, overtreatment of clinical mastitis was the big error. If farmers are still out there who think they should be tubing until all the clots have disappeared, please do them a favour and bring them into the 21st century.
It’s always sad to say farewell, but as long as it is for a good reason, it can be okay. The culling rate tracks the percentage of cows leaving the herd each year, either by sale or “retirement”. Ideally, farms should cull cows for age or poor productivity rather than preventable health issues such as lameness or mastitis.
Lest we forget, our esteemed dairy cow does serve a valuable dual purpose: she provides milk, and then beef. A canny farmer will ensure that as many of their cows as possible are culled as valuable beef animals.
When a farm tracks health KPIs such as lameness, SCC and fertility, it is better positioned to avoid the culling of cows prematurely.
We all want healthier, longer-living cows, but what we must avoid is the farmer hanging on to cows that would be better being culled. Examples include cows that are positive for Johne’s disease, or have high cell counts or are chronically lame.
Therefore, chasing a low cull rate in isolation can be a foolhardy road to take. An alternative approach is to track on-farm culls and deaths. In all circumstances, this should be below 5% of the adult herd per year, and ideally below 2%.
We all know that happy, healthy cows make more milk, but tracking KPIs that indicate “happiness”, without becoming too subjective, can be a challenge.
CowSignals18 is an approach that encourages farmers to notice and record behaviours that indicate feeding bouts, lying times and social stress.
A relatively easy one to measure is “waiting cows”. These are cows that are not either lying down (usually chewing their cud), or standing while eating. They may be stood in a passageway, or loafing in an outside yard, but often displaying “intention movements”; for example, a hesitant step forwards with one foot that is then drawn back again.
Most waiting cows are wanting to either go and lie down or go to eat. Congested passageways, uncomfortable beds, overstocking, water troughs in crossovers, blind alleys or inadequate feeding space are all possible reasons for a high number of waiting cows.
The overall space available to the cow, as well as a shed’s layout, governs cow behaviour to a very large extent, and this can have large effects on rumen health and the efficacy of milk production.
Behaviour-related KPIs are becoming more recognised and easier to measure, largely due to wearable technology. An artificial intelligence-aided camera system has recently been developed that can very accurately measure a cow’s time budget within a shed20. This, plus other emerging technologies, are ones to watch for the dairy vets of the future.
Data is transforming how we care for dairy cows, and it is allowing both vets and farmers to get ahead of health problems rather than constantly firefighting.
With KPIs to track everything from lameness to fertility performance, farms are increasingly equipped to improve herd health and welfare in measurable ways.
By using KPIs to monitor and improve performance, farms are not only meeting the goals of the Animal Health and Welfare Pathway, but they are also becoming more efficient, productive and profitable.
For us vets, it means more focused, data-backed interventions and fewer cases of trying to fix something once it has already broken.
So, next time you’re poring over a farm’s KPI data with a client, don’t just think of it as another spreadsheet. Think of it as the tool that’s helping you both keep the herd healthier, happier and, of course, milkier. And if nothing else, it’ll give you one more reason to drink an extra cup of tea.