Register

Login

Vet Times logo
+
  • View all news
  • Vets news
  • Vet Nursing news
  • Business news
  • + More
    • Videos
    • Podcasts
  • View all clinical
  • Small animal
  • Livestock
  • Equine
  • Exotics
  • All Jobs
  • Your ideal job
  • Post a job
  • Career Advice
  • Students
About
Contact Us
For Advertisers
NewsClinicalJobs
Vet Times logo

Vets

All Vets newsSmall animalLivestockEquineExoticWork and well-beingOpinion

Vet Nursing

All Vet Nursing newsSmall animalLivestockEquineExoticWork and well-beingOpinion

Business

All Business newsHuman resourcesBig 6SustainabilityFinanceDigitalPractice profilesPractice developments

+ More

VideosPodcastsDigital Edition

The latest veterinary news, delivered straight to your inbox.

Choose which topics you want to hear about and how often.

Vet Times logo 2

About

The team

Advertise with us

Recruitment

Contact us

Vet Times logo 2

Vets

All Vets news

Small animal

Livestock

Equine

Exotic

Work and well-being

Opinion

Vet Nursing

All Vet Nursing news

Small animal

Livestock

Equine

Exotic

Work and well-being

Opinion

Business

All Business news

Human resources

Big 6

Sustainability

Finance

Digital

Practice profiles

Practice developments

Clinical

All Clinical content

Small animal

Livestock

Equine

Exotics

Jobs

All Jobs content

All Jobs

Your ideal job

Post a job

Career Advice

Students

More

All More content

Videos

Podcasts

Digital Edition


Terms and conditions

Complaints policy

Cookie policy

Privacy policy

fb-iconinsta-iconlinkedin-icontwitter-iconyoutube-icon

© Veterinary Business Development Ltd 2025

IPSO_regulated

1 Feb 2022

Ocular ultrasonography – part 2

Samuel Mauchlen BVM&S, MRCVS and Chris Dixon BVSc, CertVOphthal, MRCVS conclude their article by focusing on the appearance of pathological conditions.

Chris Dixon, Samuel Mauchlen

Job Title


Ocular ultrasonography – part 2
  • Ocular Ultrasonography – part 1

Ocular ultrasonography is a safe and valuable technique for assessing the ocular structures.

However, given that probe placement involves direct or indirect pressure on the corneal surface, this imaging modality may be contraindicated in cases where severe globe or corneal trauma has occurred, or where ocular surgery has recently been performed.

Cornea and anterior chamber

Figure 1. Hidden corneal foreign body. 1a. On direct examination of the patient’s cornea the opacification caused by oedema has obscured the embedded foreign object. 1b. Using ultrasound, an echogenic foreign body can be seen embedded within the cornea (asterisk). The surrounding oedema has caused the corneal tissue to become thickened and more echogenic. Additionally, the dense foreign object is creating an acoustic shadowing artefact that is visible on the anterior lens capsule (arrow). 1c. In this case, a small, thin shard of metal was removed from the cornea.

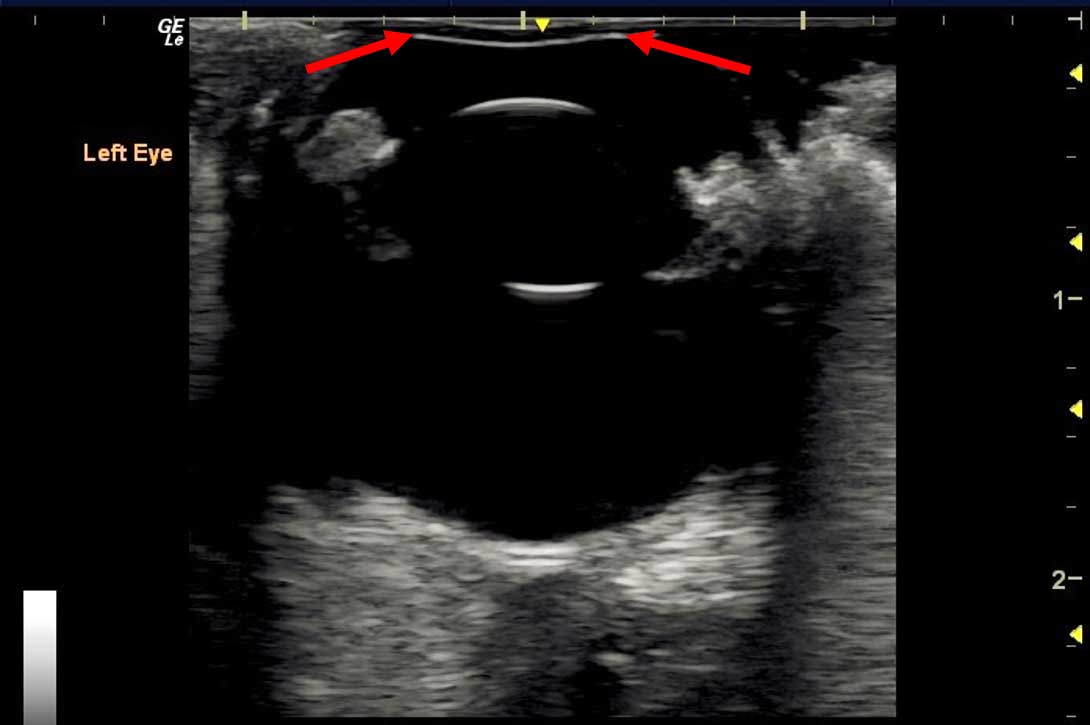
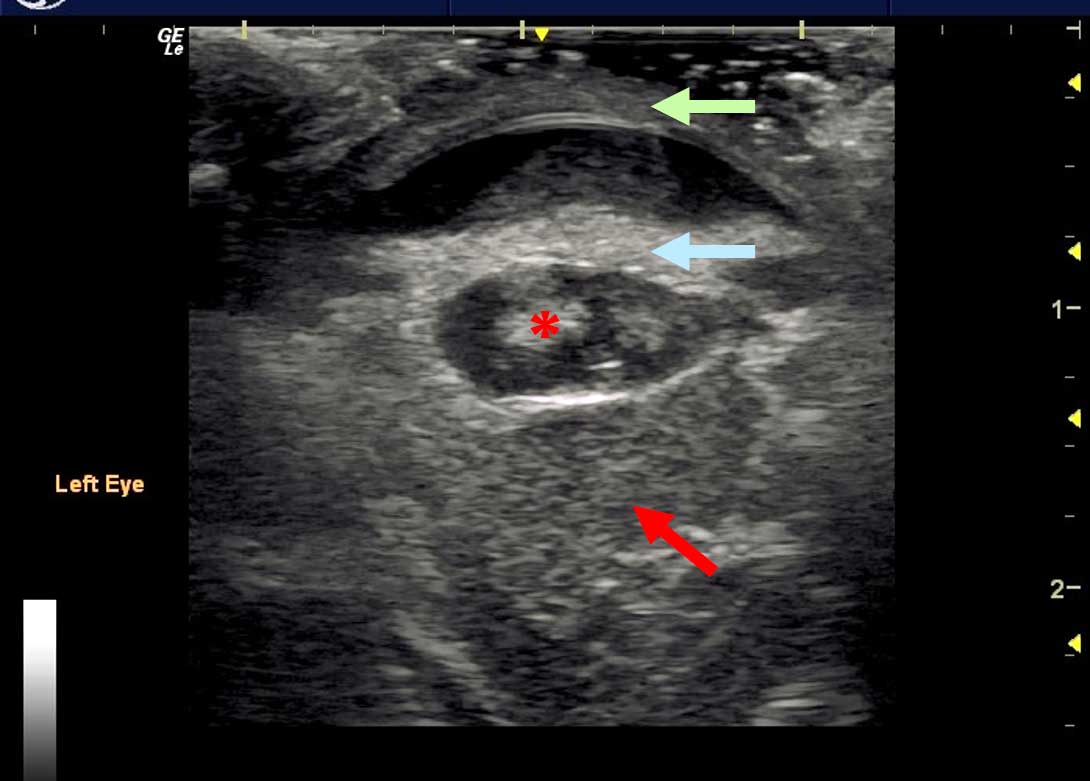
When using a medium to high‑frequency transducer (12MHz to 20MHz or higher), the three-layered nature of the cornea can be visualised.

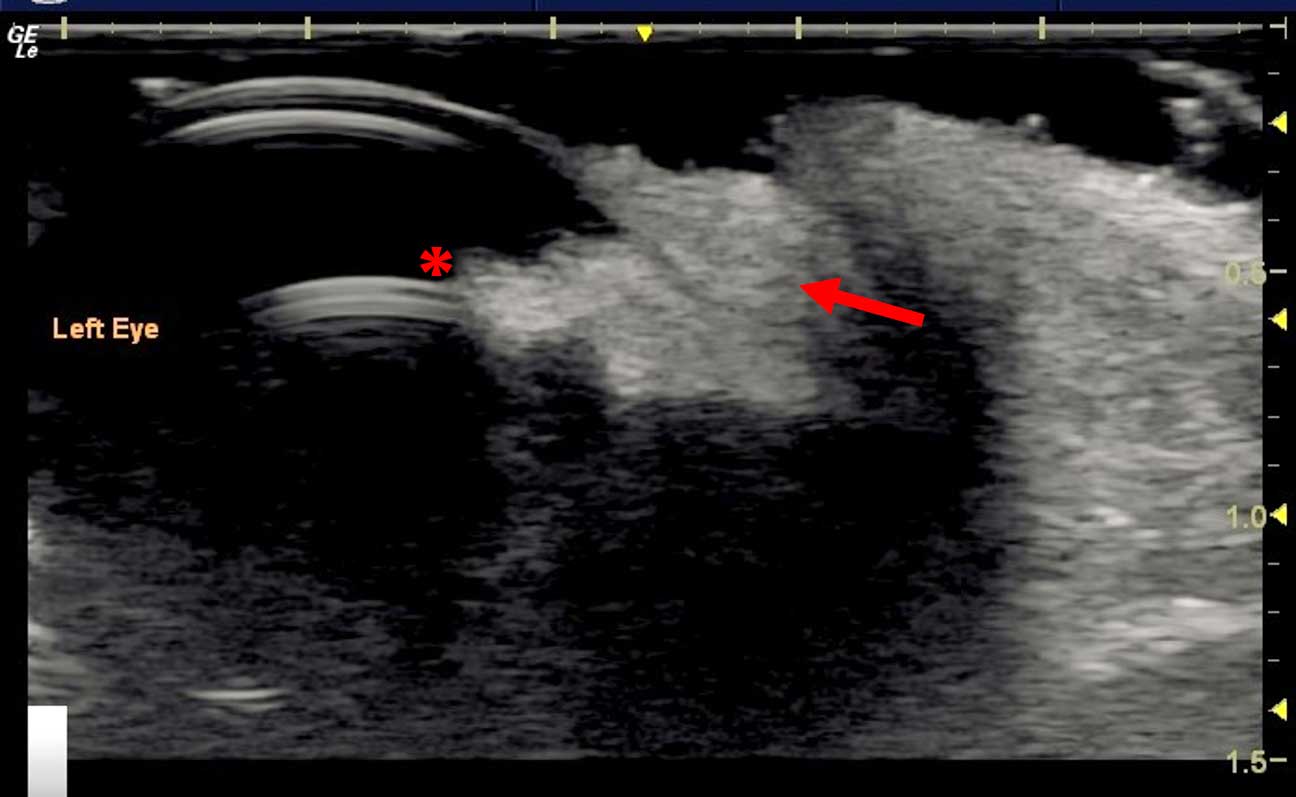
Generally, any disruption to the anterior layer would be directly visible with an ophthalmic examination (for example, corneal ulceration or sequestrum), but high‑resolution ultrasound scanning can allow for the detection of conditions that may be “hidden” due to opacification of the superficial layers (Figure 1).

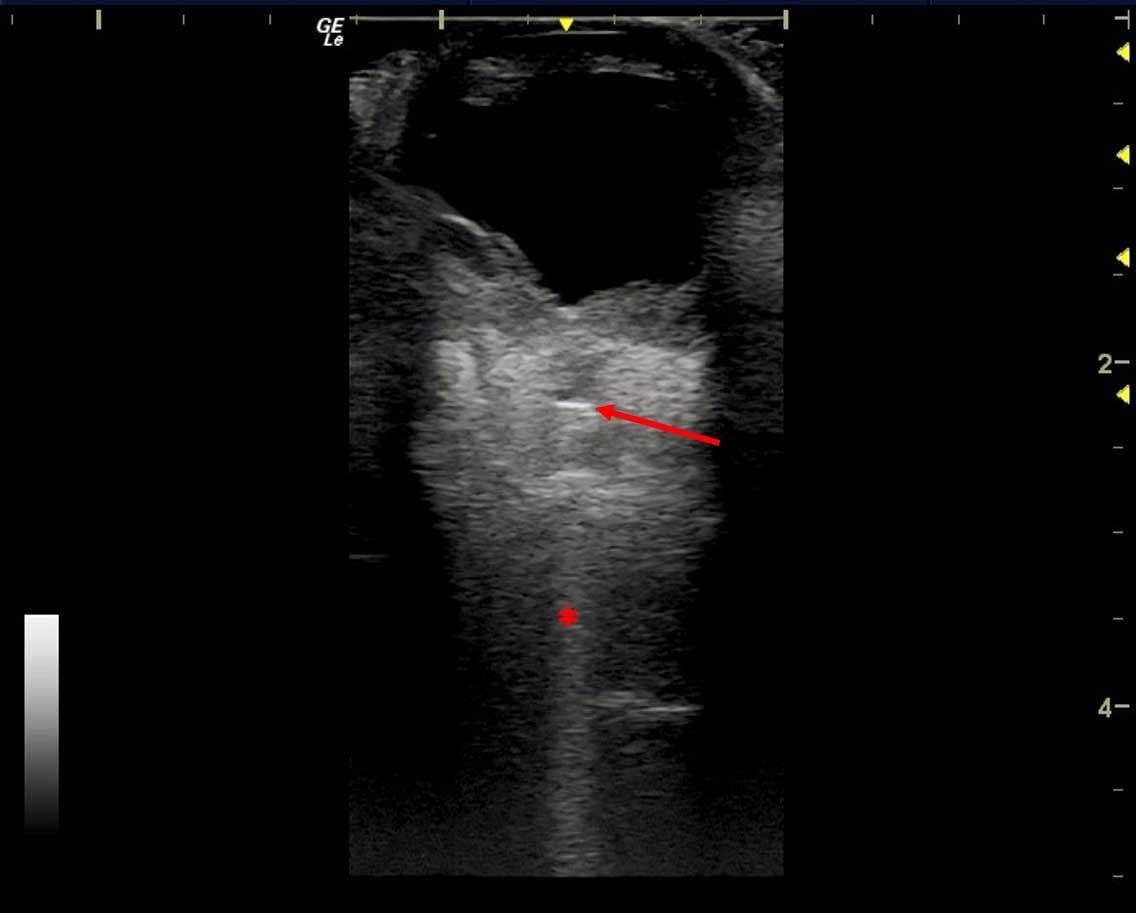
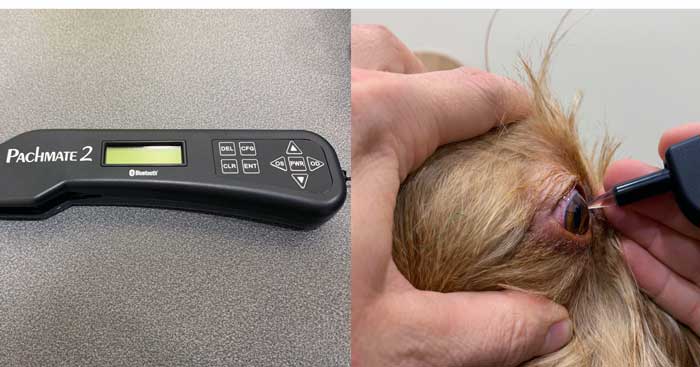
Corneal thickness can be accurately measured with an ultrasonographic pachymeter, but portable “pen” devices are expensive and only normally found in ophthalmic referral centres (Figure 2).

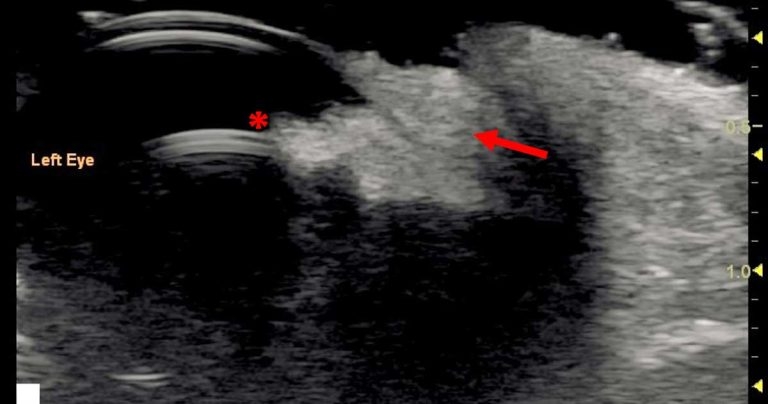
Alternatively, using a transducer higher than 12MHz may allow for measurement during B-mode scanning, provided the depth is reduced as much as possible and frequency increased to maximise resolution of the anterior structures. Flattening of the cornea will occur if excessive pressure is applied (Figure 3). This can be avoided with liberal application of a sterile acoustic coupling gel.

The normal canine corneal thickness is approximately 0.57mm1 and this can increase in conditions that result in corneal oedema due to hydration of the corneal stroma.

Figure 2. Pachymeter. 2a. Modern pachymetry devices use ultrasound to accurately measure corneal thickness. 2b. A pachymeter in use on a patient.

Ocular ultrasonography should not be performed if evidence exists of significant corneal ulceration. Direct pressure from the transducer could potentially lead to corneal rupture in cases with a deep stromal ulcer or descemetocele.

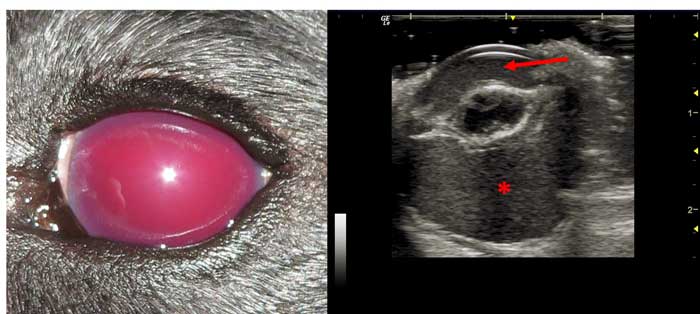
Pathology affecting the anterior chamber can be visualised as echogenic lesions within the normally anechoic chamber (Figure 4). Echogenic material can represent haemorrhage and cellular debris (for example, hyphaema or hypopyon) and can be mobile, changing position with ocular motion.

Iridociliary cysts can be identified using ultrasonography (Figure 5). These form from the neuroepithelium of the uveal tract in the posterior chamber and can “float” into the anterior chamber. The cysts are roughly spherical and on ultrasound appear as thin echogenic walls with an anechoic centre. Golden retrievers, Labrador retrievers, great Danes and Boston terriers are predisposed, although other breeds can be affected.

Small individual iridociliary cysts are usually considered to be an incidental finding, although larger cysts can obscure vision, and an accumulation of cysts has been associated with uveitis and glaucoma2,3.

Figure 3. In this image, direct pressure from the probe placement on the cornea has caused the normally convex cornea to flatten (between arrows). This can be avoided by the liberal use of sterile acoustic gel.
Figure 4. Hyphaema. 4a. The frank blood filling the anterior chamber of this patient prevents direct visualisation of any structures posterior to the hyphaema. 4b. In this case, ultrasound allows assessment of the posterior structures. The normally anechoic anterior chamber is filled by homogenous, echogenic frank blood (red arrow). The lens volume is reduced and echogenic areas are present within the normally anechoic lens, indicating cataractous change. The vitreous body within the posterior segment is also filled with homogenous, echogenic frank blood (red asterisk).
Figure 5. Iridociliary cysts. 5a. An iridociliary cyst can be seen within the anterior chamber (red arrow). 5b. In this enlarged image of the cyst (red arrow), the thin echogenic wall and an anechoic central area can be seen.

Lens

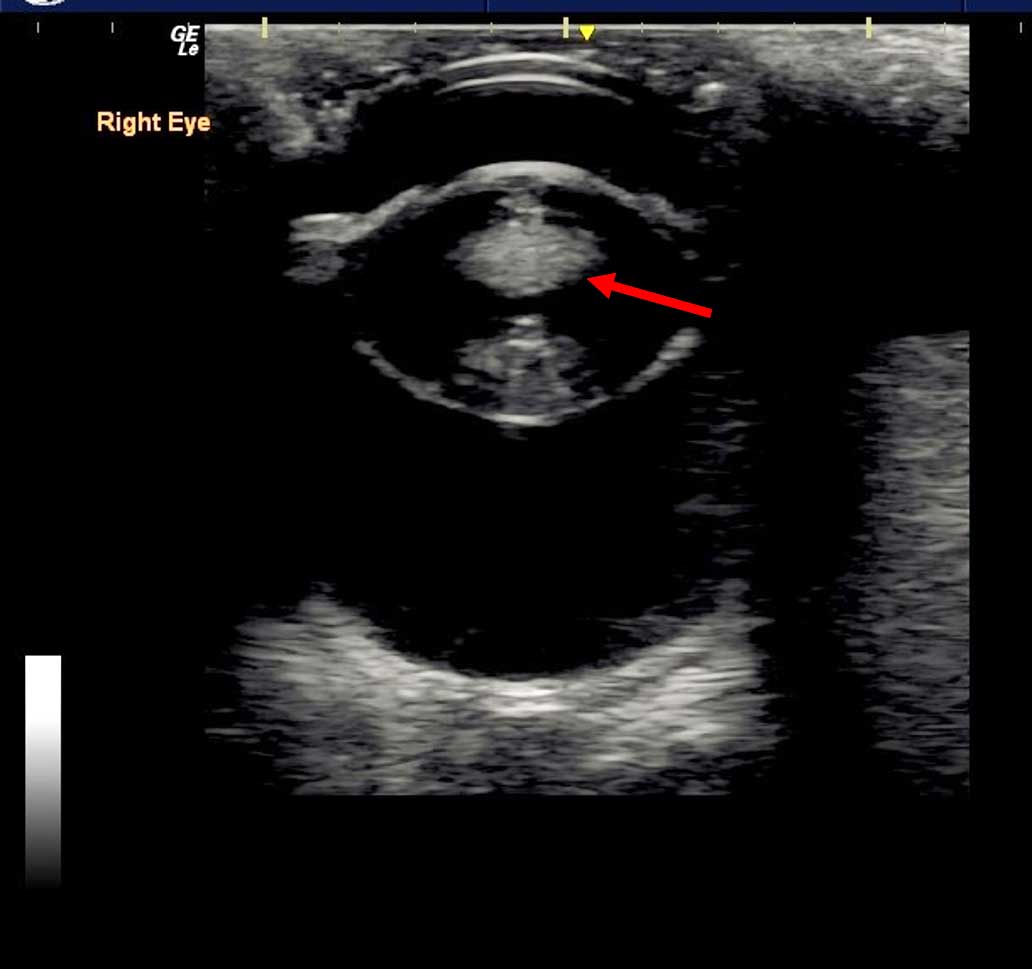
Ultrasound can be used to assess the lens and can be particularly useful in cases of cataract formation.

Caused by degenerative changes in the solubility of lens proteins, cataracts can be classified based on their location within the lens and the volume of the lens that the changes occupy. Changes in lens thickness in cataract cases have been described4.

On ultrasound, cataracts appear as echogenic areas within the normally anechoic lens (Figure 6).

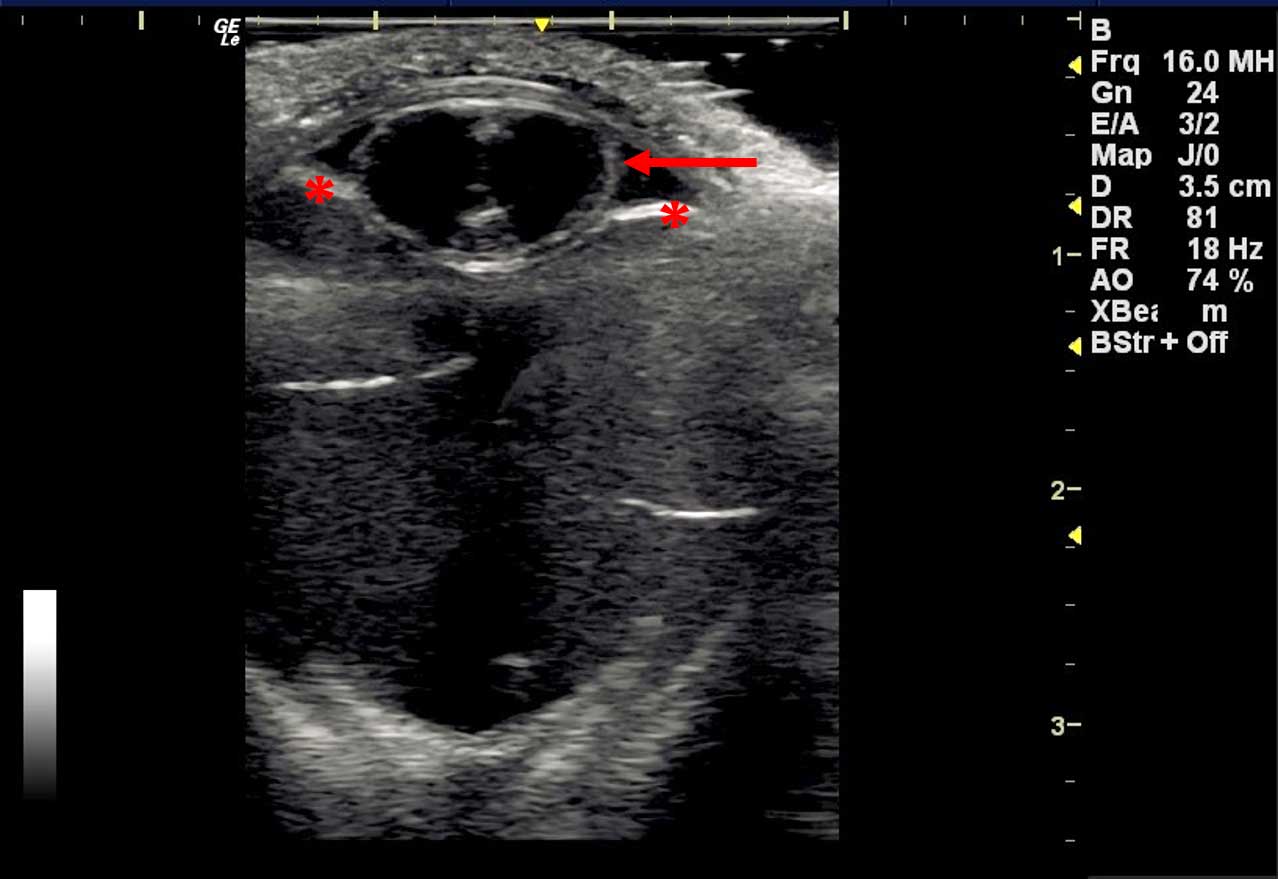
Ocular trauma, glaucoma, chronic uveitis, neoplasia, and conditions that affect lens volume or stiffness can lead to stress and eventual rupture of the zonule fibres that support the lens. This loss of support can cause subluxation or full luxation of the lens.

Subluxation may allow the lens to move or wobble (phacodonesis). The position of the lens may appear asymmetrical on ultrasound examination, although it will remain immediately posterior to the iris and anterior to the vitreous body.

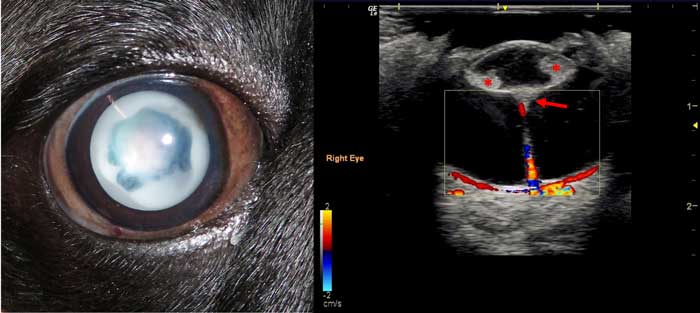
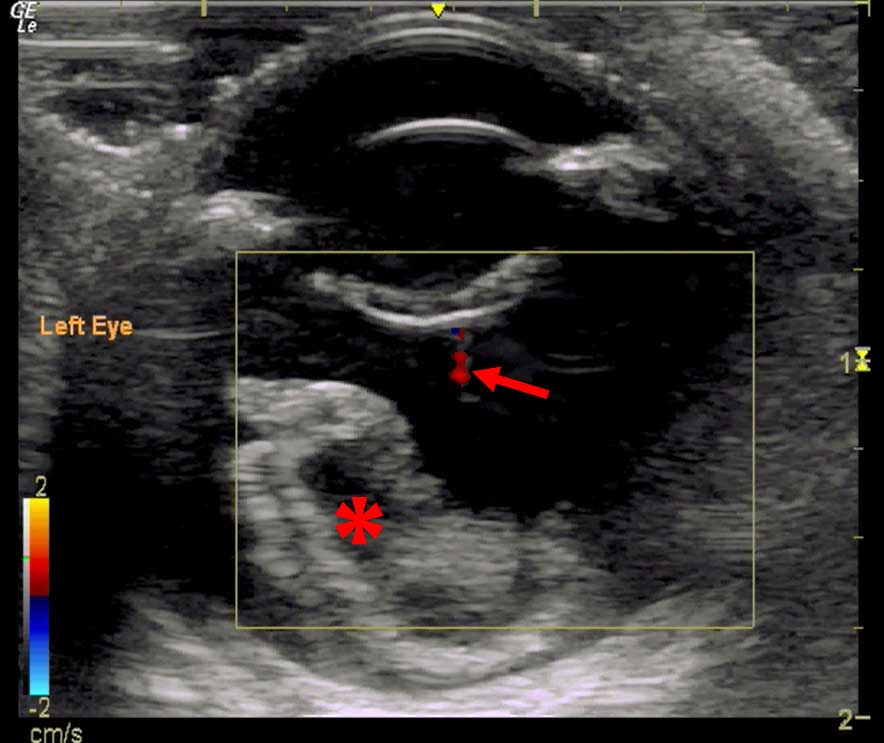
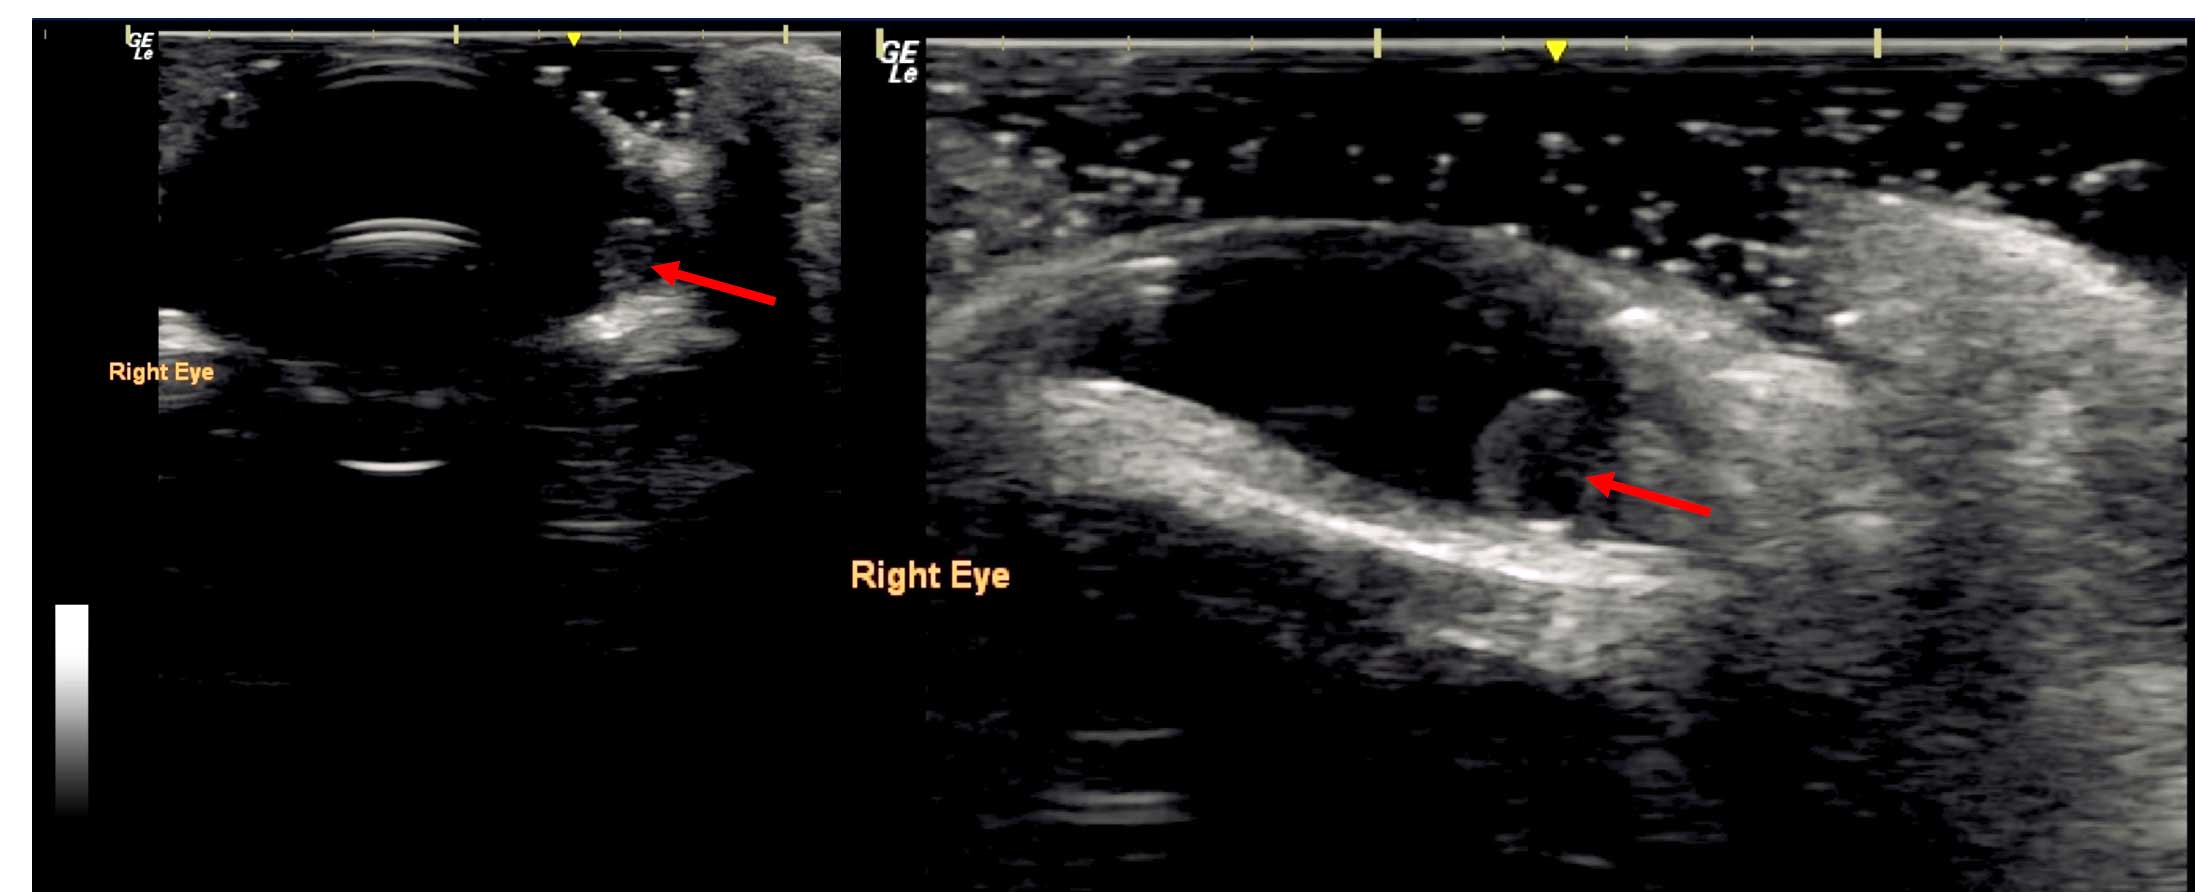
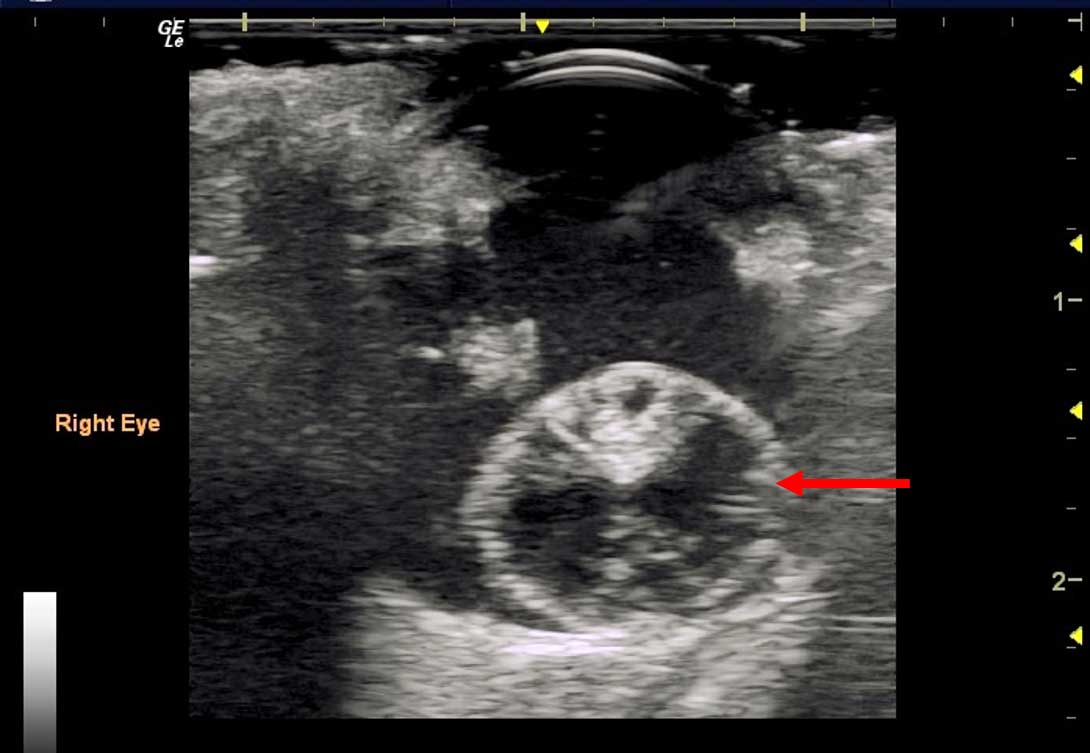
Lens luxation will allow the lens to move completely out of its normal position. If it moves into the anterior chamber, it can be visualised immediately posterior to the cornea (Figure 7). If the lens moves posteriorly, it will be visible within the vitreous body (posterior segment; Figure 8).

A fully luxated lens will be metabolically stressed and often can appear cataractous, exhibiting internal changes such as those described previously.

Figure 6. In this image of the right eye, the central portion of the normally anechoic lens has become echogenic, indicating the presence of a cataract (red arrow).
Figure 7. Anterior lens luxation. The lens is located within the anterior chamber (red arrow) anterior to the iris (asterisks).
Figure 8. This image shows a patient with posterior lens luxation. The lens is located within the posterior vitreous chamber (red arrow). The surrounding vitreous contains echogenic material due to haemorrhage and inflammation.

Vitreous chamber and retina

Figure 9. In this image, asteroid hyalosis can be seen as multiple echogenic foci within the vitreous chamber (between the red arrows). The lens shows signs of a mature cataract with increased echogenicity of the lens tissue and decreased lens volume (asterisk). Posterior vitreal detachment (PVD) is present, appearing as a hyperechoic line in the posterior vitreous chamber. The ultrasonographic appearance of a PVD is very similar to a retinal detachment and it may not be possible to distinguish between the pathologies; however, a detached retina would normally remain connected to the optic disc (see Figure 13).

The vitreous chamber normally appears anechoic. Echogenic opacities within the chamber can be caused by a number of different conditions.

Asteroid hyalosis is caused by calcium lipid complexes that are suspended throughout the vitreous, and are a common cause of vitreal opacities in older patients, brachycephalic breeds and Italian greyhounds (Figure 9).

Other forms of vitreal degeneration can be visualised ultrasonographically5 and are commonly seen in dogs with cataract formation.

Vitreal opacities can also be seen in cases of inflammation and infection (Figure 10).

Haemorrhage within the vitreous chamber can cause the formation of echogenic opacities or an echogenic mass. Causes of haemorrhage include:

  • trauma6
  • neoplasia
  • coagulopathies
  • hypertension
  • retinal disease
  • glaucoma
  • diabetes
  • persistent hyaloid artery (Figures 11 and 12)

Organised clots within the chambers of the eye can be difficult to distinguish from neoplastic lesions7. In these cases, Doppler ultrasonography can be used to distinguish between the active flow in a vascularised neoplastic lesion and the lack of flow in an organised clot.

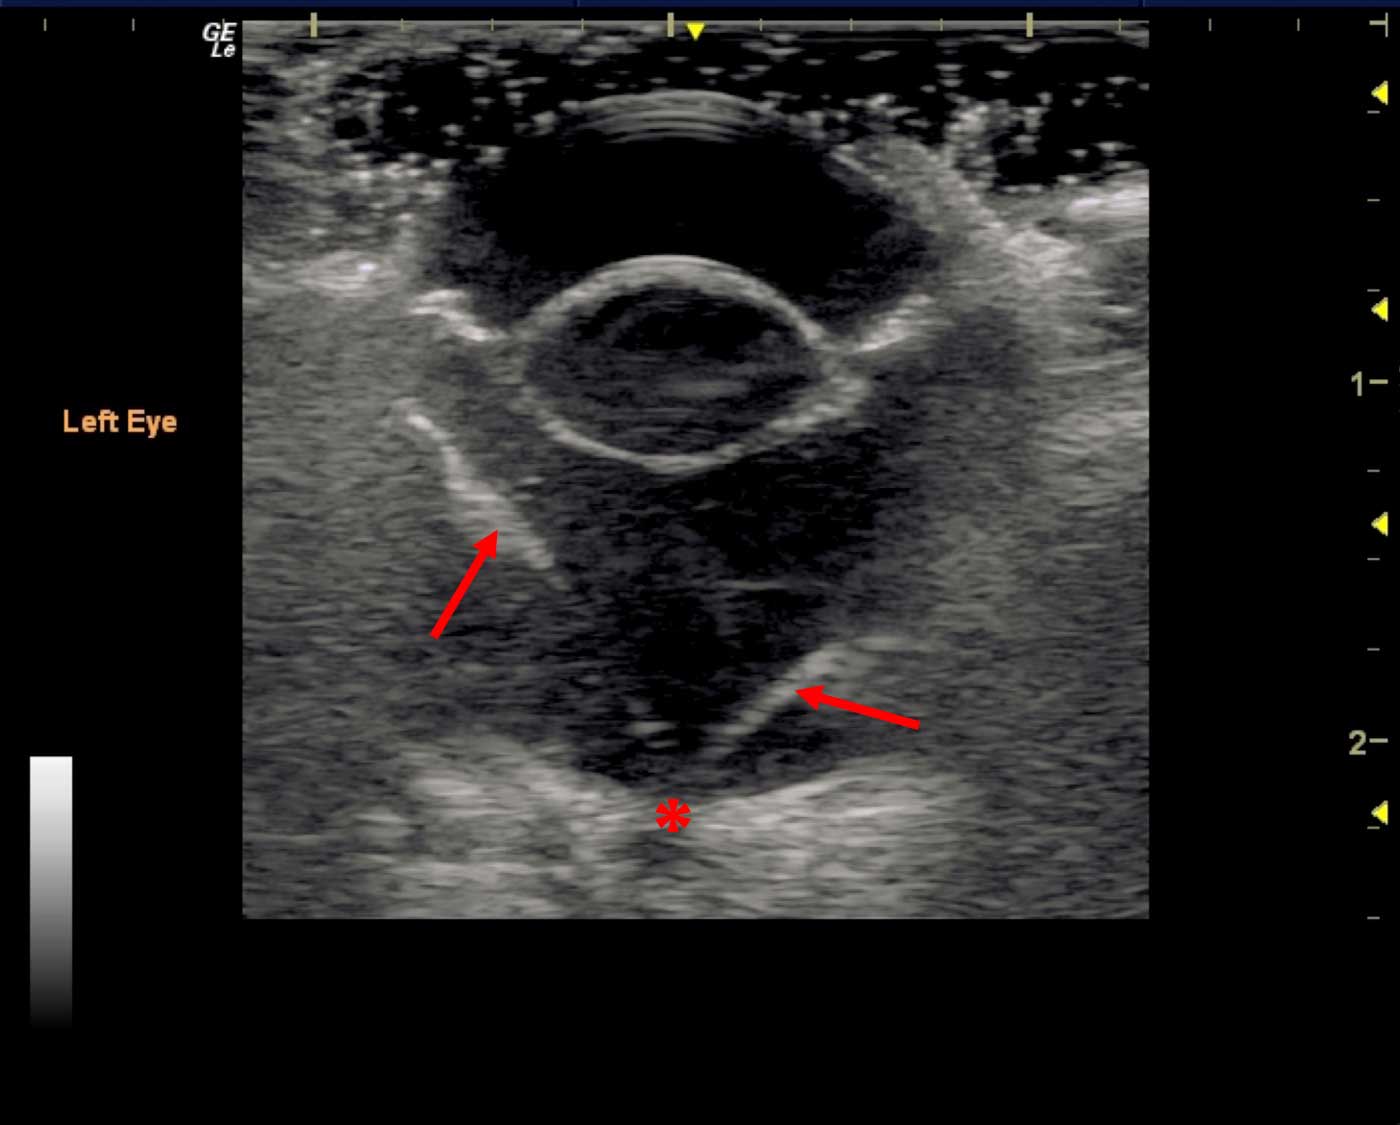
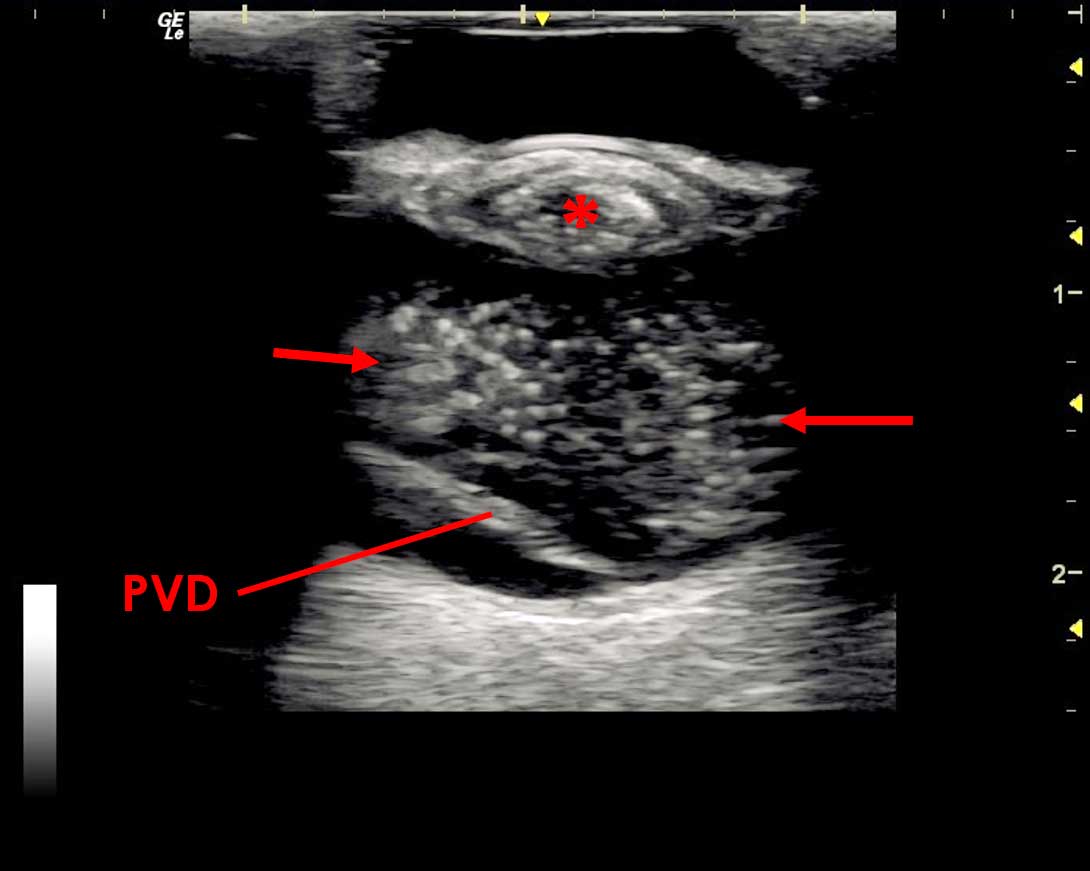
Retinal detachment can have a characteristic appearance and is commonly diagnosed using ultrasonography. The retina is not normally distinguishable from the other posterior layers of the globe wall.

Figure 10. Endophthalmitis. In this image, the posterior segment is filled with echogenic foci caused by the presence of inflammatory cells (red arrow). Ultrasonographically, this may appear very similar to diffuse haemorrhage. Additionally, an echogenic area is present within the lens, representing a cataract (asterisk). Inflammatory infiltrates are present within the anterior chamber, creating a layer of echogenic material. This has adhered to the anterior lens capsule and obscures the iris (blue arrow). The cornea is thickened, showing loss of the ultrasonographic layering we would expect to visualise (green arrow).

Detachment appears as a thin echogenic interface within the vitreous chamber, with underlying anechoic space separating it from the combined choroid and sclera.

The retina usually remains attached at the optic disc posteriorly and the ora serrata near the ciliary body anteriorly. Complete detachment will lead to a “V” or “Y”‑shaped appearance within the vitreous chamber (Figure 13).

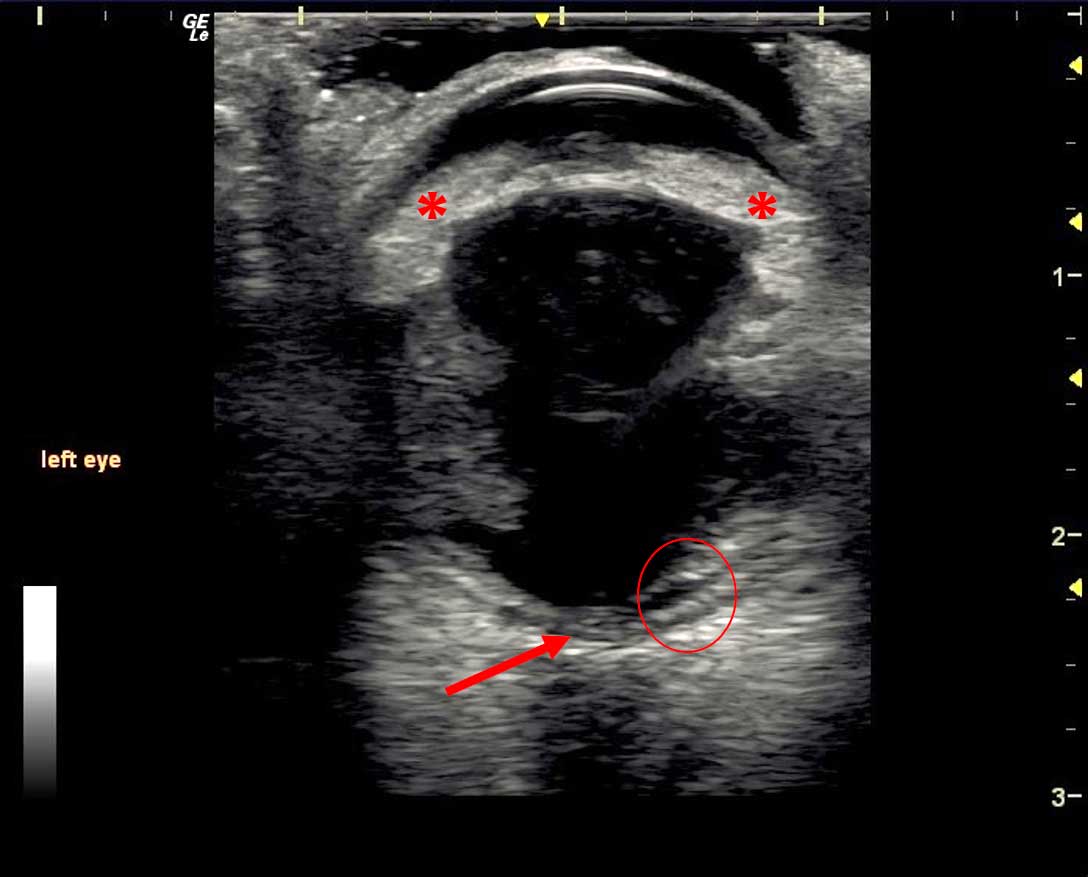
Retinal detachment can occur secondary to severe inflammation of the choroid. Although this layer is difficult to evaluate, in cases of severe inflammation the choroid becomes oedematous. This can be visualised as thickened hypoechoic layer between the sclera and retina (Figure 14).

Within the area denoted by the red circle, the normally combined appearance of the posterior tissue layers has been lost.

From anterior to posterior, the layers seen are the echogenic interface of the detached retina, an anechoic area of subretinal oedema, a thickened choroid with a band of hypoechoic choroidal oedema, and the scleral layer.

Intraocular neoplasia

Intraocular neoplasia can be focal or diffuse and affect different parts of the eye (Figure 15).

Additionally to visible masses and structural changes to the ocular anatomy, neoplasia can cause glaucoma, haemorrhage and uveitis.

Ultrasound is extremely valuable in evaluating neoplastic pathology as it can help to define the extent of the pathology, especially when normal structures are obscured.

Choroidal melanocytic neoplasia is the most common ocular neoplasia seen in dogs and cats8,9. Ciliary body adenomas/adenocarcinomas are the second most common in dogs10.

Post-traumatic fibrosarcomas are seen in cats. Less commonly, haemangiosarcomas, lymphoma, medulloepithelioma, astrocytomas and meningiomas are seen.

Ocular foreign bodies

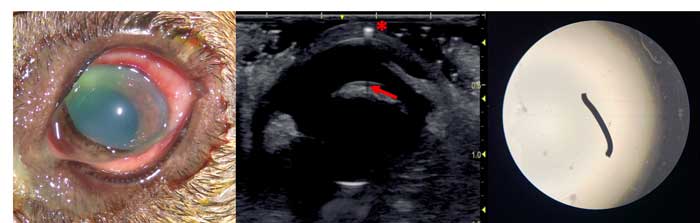
The ultrasonographic appearance of foreign bodies will vary depending on their composition.

Ultrasound can be used to establish their presence, but also to evaluate the position of foreign objects prior to removal.

Other imaging modalities – such as radiography, CT and MRI – can also be useful in evaluating orbital foreign bodies.

Retrobulbar pathology

Ultrasound examination can be very rewarding and is a very useful first‑line technique for evaluating the retrobulbar structures11 following a complete ophthalmic examination.

CT and MRI can also be valuable for evaluating the retrobulbar anatomy, although availability and expense may limit their use. Additionally, radiography should be considered to assess bony involvement in pathology.

Neoplasia can be primary – from the structures within and around the retrobulbar space – or secondary with metastatic spread.

The ultrasonographic appearance of neoplasms can vary in echogenicity and masses can cause deformation of the posterior globe.

Inflammation of the retrobulbar structures can vary in appearance (Figure 16). Diffuse cellulitis can result in the retrobulbar fat appearing more hyperechoic.

The change in tissue echogenicity can be subtle, and it is always useful to compare the affected and normal eye when assessing the retrobulbar structures.

Abscesses and cystic lesions can also be seen within the retrobulbar space. These may have an echogenic rim with hypoechoic or flocculent content.

The zygomatic salivary gland is located ventral to the retrobulbar tissue, and cases of sialocele or sialoadenitis can cause enlargement of the gland and protrusion into the retrobulbar space – this can also appear as a cavitary lesion.

In cases of retrobulbar disease, ultrasound can be used to guide fine needle aspiration to avoid damaging the neighbouring structures, such as the globe, optic nerve and blood vessels. This technique can also be used in the drainage of cavitary lesions.

Conclusion

Ocular ultrasonography is an extremely important and versatile diagnostic modality that can be performed safely in the majority of patients.

Ultrasonography can reveal information that would otherwise have remained unknown with direct visualisation of the eye and can enhance the clinician’s ability to reach an accurate diagnosis.

  • Ocular Ultrasonography – part 1
Figure 11. Persistent hyaloid artery (PHA). 11a. On direct examination, the cataractous changes within this patient’s right eye can be seen. 11b. A B-mode ultrasound of the same patient shows reduction in lens volume, with cortical cataractous changes visible as echogenic areas within the normally anechoic lens (asterisks). A PHA is present a retrolenticular plaque can be seen at the attachment of the PHA to the posterior lens (red arrow). This image also shows the use of Doppler ultrasonography with coloured pixels representing vascular flow within the PHA and the choroid.
Figure 12. Persistent hyaloid artery and haemorrhage. This ultrasound image shows the left eye of a patient with a persistent hyaloid artery. The Doppler shift from vascular flow within the artery is shown by the red pixels (red arrow) indicating flow towards the ultrasound transducer. An organised clot is present within the vitreous chamber (*), which is not registering any vascular flow within the colour Doppler sample gate (yellow square).
Figure 13. Total retinal detachment. This image shows the classic “V” shape formed by detached retinal membranes (red arrows). The attachment at the optic disc can still be seen (asterisk) and may help to differentiate a retinal detachment from a posterior vitreal detachment.
Figure 14. This B-mode ultrasound image shows the left eye of a patient that had panuveitis secondary to fulminant disseminated fungal infection. The Iris and ciliary body are thickened and irregular (asterisks), and the optic disc has become swollen and hypoechoic (red arrow). Within the area denoted by the red circle, the normally combined appearance of the posterior tissue layers has been lost. From anterior to posterior, the layers seen are: the echogenic interface of the detached retina, an anechoic area of subretinal oedema, a thickened choroid with a band of hypoechoic choroidal oedema, and the scleral layer.
Figure 15. Invasive ocular neoplasia. An irregular heterogenous mass (red arrow) can be seen extending from the corneal limbus into the anterior chamber and anterior lens capsule (asterisk).
Figure 16. Retrobulbar foreign body. A linear hyperechoic structure representing a foreign body is present within the retrobulbar space (red arrow). The dense foreign material is creating a distal reverberation artefact (asterisk) and the surrounding retrobulbar tissues are inflamed, appearing more hyperechoic and irregular.